This is an old revision of the document!
Log Background Colour
This page describes how to change a background colour in GS3D for better visualization.
The steps below is how to change everything that we want to be shown, is given a different colour, and the rest is set to transparent.
1. Go to “Object Properties…” on you Log object
2. Go to the tab “Material”
3. Click “Advanced…”
4. In the tab “General” set “Blending Mode:” to “Transparency”
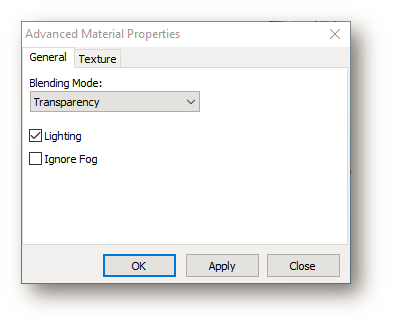
5. In the tab “Texture” set “Texture Mode:” to “Modulate”
6. In the tab “Texture” set “Image Alpha:” to “SuperBlackTransparent”
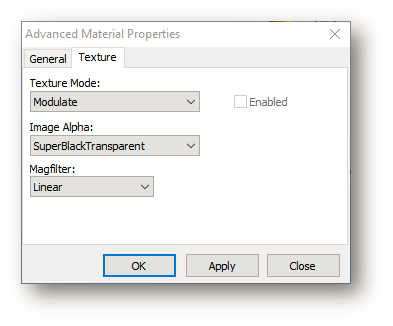
7. Click “OK”
8. Go to the tab “Geometry”
9. Click “3D Chart Data Setup…”
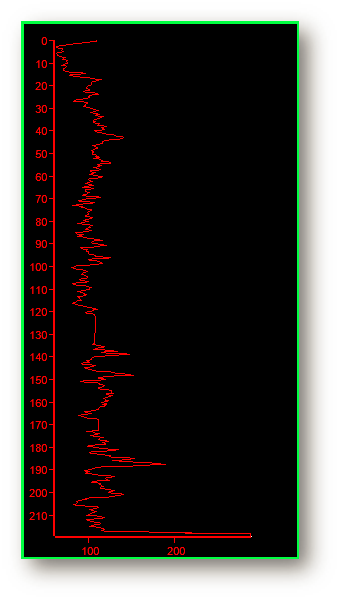
OBS: Goal is to make the chart look like this:
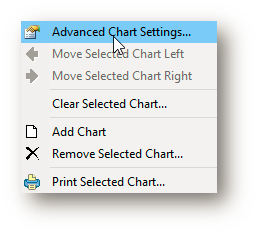
10. Right click the chart
11. Select “Advanced Chart Settings…”
12. Go to the tab called “Panel” found under “Chart”
13. Set the color to black under the “Color” tab
14. Go to the tab called “Image”
15. Upload an image file which is completely black (can easily be created from e.g. paint in a few seconds)
16. Make sure “Back Image Inside” is hatched
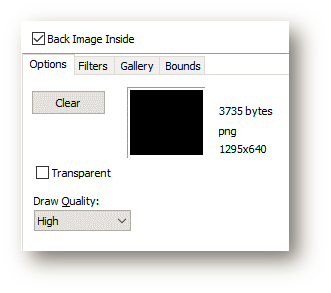
17. Go to the tab called “Axis” found under “Chart”
18. First select “Left Axis”
19. Go to the tab called “Labels”
20. Go to the subtab called “Format”
21. Go to the subtab called “Font”
22. Set the “Font” color to red
23. Go to the tab called “Axis”
24. Set the color to red
25. Go to the tab called “Ticks”
26. Set the color to red
27. Redo from 18 for “Bottom Axis”
28. Go to the tab found under “Series” (left panel, where “Chart” were also found). The tab under series will be named as you specified log and will therefore be variable.
29. Set the color to red
If you want more labels to be shown as well, just change the color to e.g. red and they will be visible as well.
