Pinch out of layers (Smart Interpretation)
This tutorial describes how to handle surface near layers that pinch out locally – an example based on SI (Smart Interpretation).
Background and case description
This guide shows an example of how to handle layers that pinch out or are of local character. The example is based on a layer created using Smart Interpretation (SI).
The given example is based on a large AEM survey in an area with soft sediments in the middle and southern parts, and mountain ranges to the north. Hence the topography is rough in the northern areas and flat in the middle and southern parts of the survey area where we also see local outcrops of bedrock.
The survey area is 250 x 130 km and the distance between the flight lines is approx. 2 km.
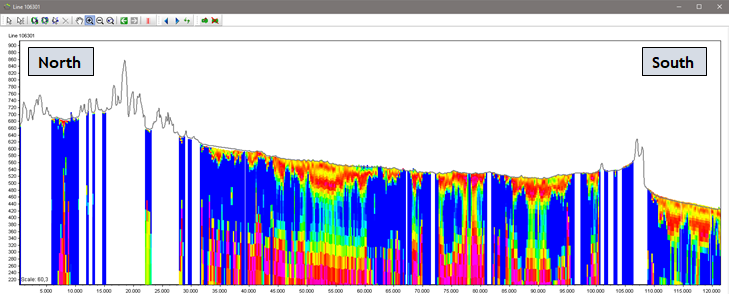
A sandy, highly resistive, layer is identified in the upper strata, locally cut off by the bedrock.
A typical geophysical cross section is shown below.
Step 1.
A geological layer defining a sandy unit, is interpreted in GeoScene3D. The top of the layer is defined by terrain and the base is interpreted in the GeoScene3D interpretation point database.
Smart Interpretation is a tool to speed up the interpretation process and is here used to interpret the geological target defining the base of the sand unit.
A general workflow using the SI tool is:
1) Add interpretation points on a few cross sections evenly distributed in the area
2) Apply the SI algorithm locally on these cross sections
3) Apply additional points where the auto-picker doesn’t perform well
4) Rerun the algorithm, and check the results
5) Points 4 and 5 are repeated iteratively until you are satisfied with the overall result.
6) Apply the SI algorithm globally
7) Make a quality check of your results and make a few adjustments if necessary
8) The points are then accepted and stored in the interpretation point database.
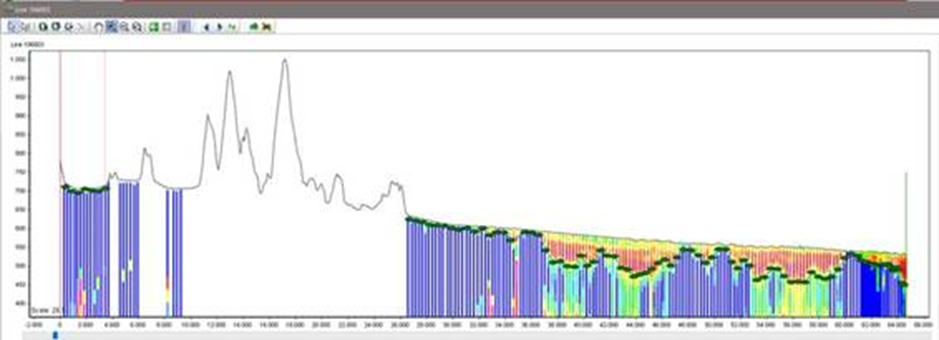
The SI algorithms output interpretation points representing the geological surface. An example is shown below. In this example the algorithm has been told not to output any interpretation points above terrain.
Step 2.
As default, GeoScene3D will assign a Point Type value of “0” to all these points, and all user-defined points will also have a Snap ID.
All cross sections (in this project defined as flight lines) has been inspected manually. In this step the following adjustments has been made:
• Deleting points which differs from the expected fit to data. A high STD-value (calculated by SI) would normally be associated with these points, however deviating points with low STD-value can occur.
• Adjust points by moving them up or down for a better fit to actual data. Normally this is only necessary on a few points. Another quick way is to simply delete these points and add new ones, like above.
In case a point has been moved, a unique Point Type value has been assigned by the user (e.g. “1”). A user defined STD-value can be assigned too.
• Adding points in areas where no Smart Interpretation points have been defined, i.e. in areas where the surface comes to terrain (the layer pinch out). In those areas “assisting” interpretation points have been added to control the interpolation of the resulting surface grid.
These points have been added a few meters above terrain. This process might rely on a bit of trial and error. Points that are added high above terrain get a relatively high impact on the resulting interpolated surface, whereas points added close to the surface will have difficulties to “force” the surface above terrain. All assisting interpretation points are given a unique Point Type, e.g. “2”. A user defined STD-value can also be assigned. Our suggestion is to set it low, e.g. 0,1. to make their control of the interpolation as high as possible (Note: In GeoScene3D STD-values are only used in the interpolation when using Kriging as an algorithm).
The descripted workflow, exclusive the Smart Interpretation, can be done in approx. one day for a survey like this example.
The use of Point Types allows the user to exclude or select individual Point Types, e.g. for interpolation or visualization – see examples below.
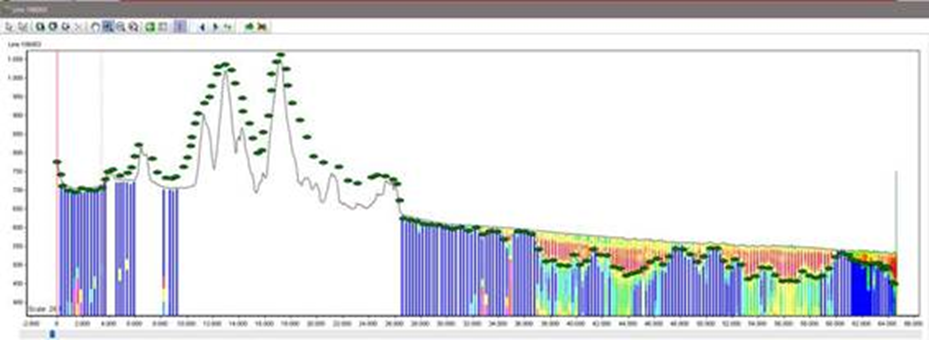
Cross section showing all interpretation points, including assisting points where the upper high resistivity layer pinch out due to bedrock outcrop or other geological features.

Cross section showing Smart Interpretation points and manually defined points. Assisting interpretation points has been excluded using a simple SQL in GeoScene3D (see text below).
Step 3.
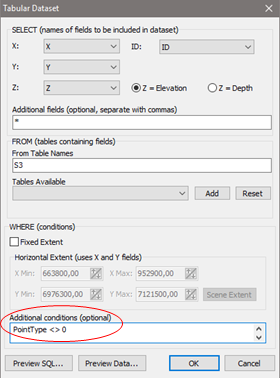
SQL’s can be defined on the individual point datasets in GeoScene3D and by that, be used to e.g. exclude certain Point Types, Point Values, STD-values etc.:
1) Go to the Object Properties for the actual point dataset. Select the “Data” tab and press “Edit…”
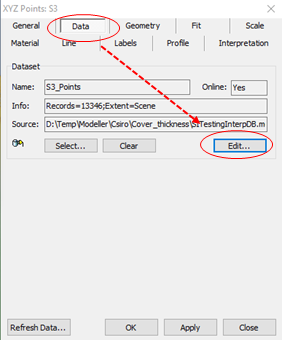
2) Press “Configure Dataset…”…
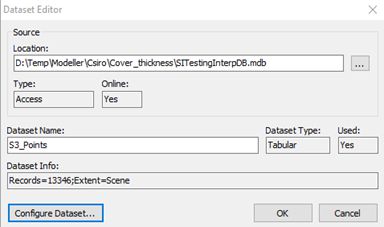
3) …and write the SQL in the “Additional conditions (optional)” field – see below. (Note: Point Type values used are depending on your own definition). The SQL shown selects all other Point Types than type no. “0”.
The last steps are to interpolate the points (all points) to a surface, adjust to terrain and optionally define a layer unit – see below.
Result
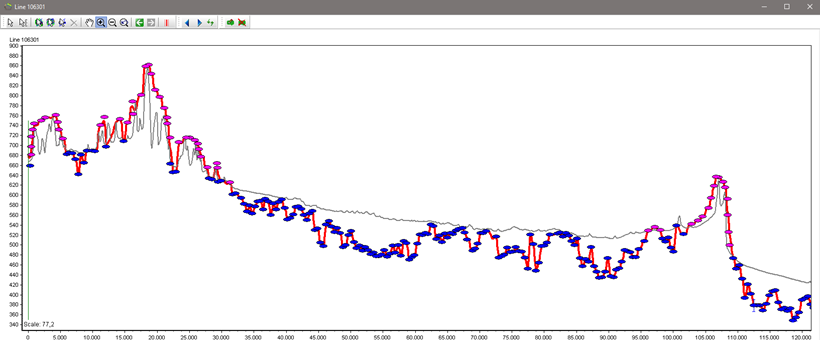
Cross section showing Smart Interpretation points (blue), manually defined points (blue), assisting points (pink), terrain (grey line) and the interpolated surface based on all interpretation points (red line).
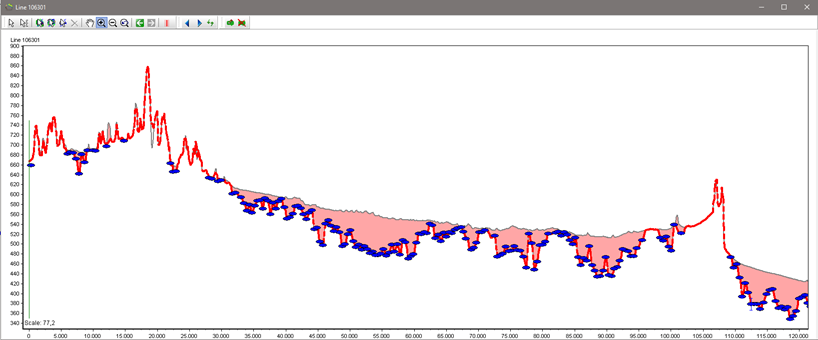
Same cross section only showing Smart Interpretation points (blue), terrain (grey line), the interpolated and then adjusted surface (red dashed line) and finally the Solid Layer defining the upper (high resistivity) sand layer in the model.
