This is an old revision of the document!
Cluster Calculations
This tool can be used if you have a big unlabeled dataset and you need to group all information into smaller categories or clusters. A number of clusters (k-centroids) needs to be defined for running the tool. It's an iterative process where each cluster is associated with a centroid. In the calculative process the sum of distances minimizes between the datapoints and their corresponding clusters. The tool will assign each datapoint to its closest k-centered centroid and a cluster is created hence each cluster will have commonalitites away from other clusters.
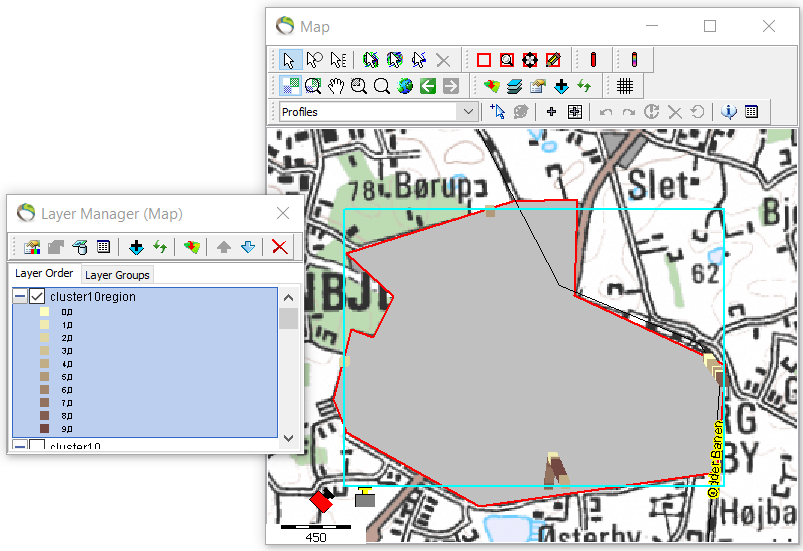
Alt om Cluster Wizard. The cluster calculation can now be run within layers and region. Furthermore, the output cluster points are shown on the top plot as default.
Requirements:
- 1D data
Step 1. Cluster calculation in layers
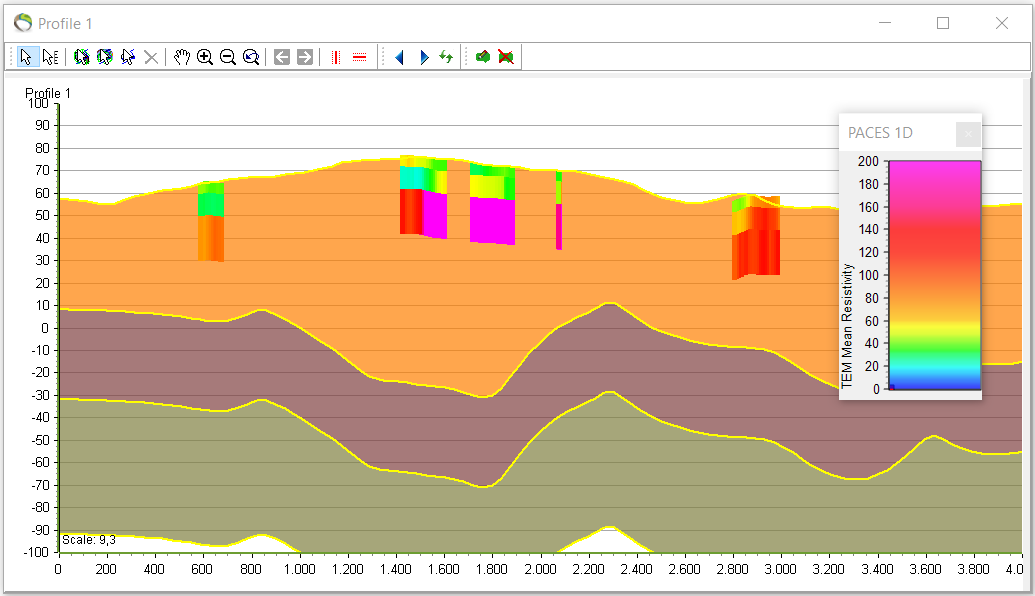
1. Open profile and get a data overview in order to evaluate the number of clusters needed.
- A layered profile showing 1D PACES data.
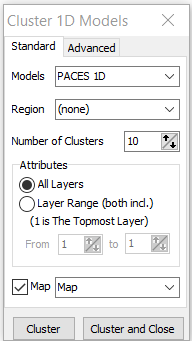
2. “Themes” menu –> “Cluster 1D Models…”.
- In “Models” different 1D geophysical data can be chosen. Here for PACES data.
- In previous profile PACES data was assesed according to the number of clusters. 10 clusters were chosen for all layers.
3. The resultant cluster information is added to the topplot.
- The volume of clusters can be observed in the range of 4-6 clusters for the PACES data.

Step 2. Cluster calculation within regions
1. Repeat step 1.2. and pick “Region”.