Smart Interpretation Wizard v707 and lower
If you're still using this version and want to use smart interpretation, it is highly recommended to upgrade to newest version for enhanced possibilities. Wiki page for the new Smart Interpretation is here.
This tutorial describes how to use smart interpretation Wizard in GeoScene3D.
Step 1.
The ‘Smart interpretation Wizard’ is used to calculate new interpretation points from already existing interpretation points. The algorithm learns the trend from 1D models and existing points and uses it to estimate new interpretation points at the positions of the 1D models.
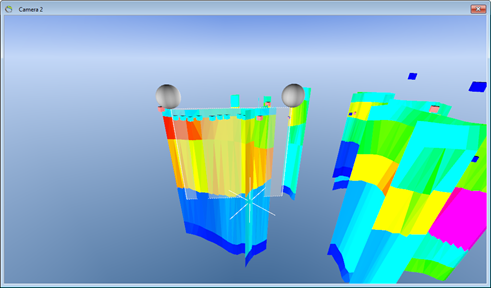
The output is a number of XYZ points. The output points can be
- Added directly to the interpretation points during editing.
- Added as a new XYZ point object.
Step 2.
When using the first mode, it is important to know, that all points previously added by the smart interpretation, will be deleted, before the new ones are added!
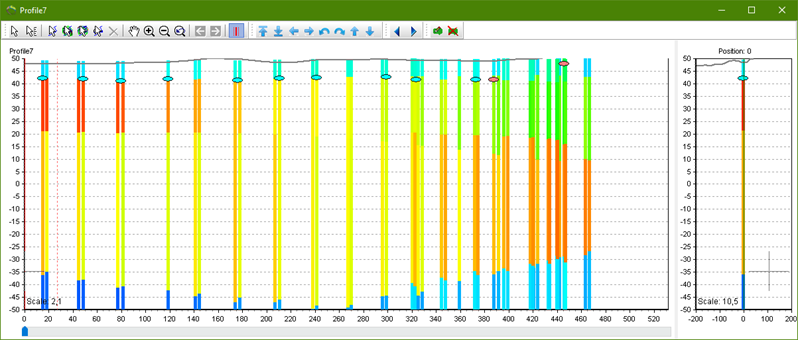
- To add the theme output to the interpretation points (1), you first have to set up points and layers for modelling by using the ‘Setup Model Data Wizard’, and then start an edit session on the XYZ points. Draw a profile and add points to the layer like in the figure below (light blue points are added points). Start the interpolation session wizard from the ‘XYZ Points Editor’: Actions… → Point Themes → Locate Layer Wizard…
2. To use the theme output points to create a new XYZ point object (2), start the ‘Smart Interpretation Wizard’ from the ‘Themes’ on the GeoScene3D main window.
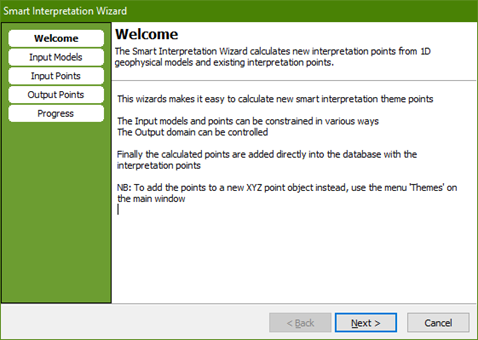
The first pages in the wizard are identical for the two output modes:
Step 3.
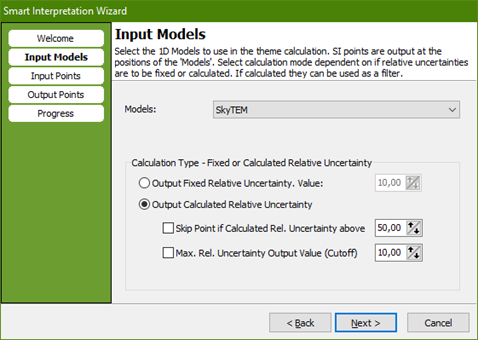
Input Models page: Select the 1D models. Only if all the models have the same number of layers, they will appear in the list. Here you have the option to choose between two calculation types.
- Output Fixed Relative Uncertainty – this calculation will add a fixed relative uncertainty value to all the points, e.g. 10.
- Output Calculated Relative Uncertainty – Adds a relative uncertainty to each point. There are two options more to this calculations.
- Skip point if the calculated relative uncertainty is above a certain value, e.g. 50. All points above this value will be skipped and will not be used in following Kriging interpolation.
Step 4.
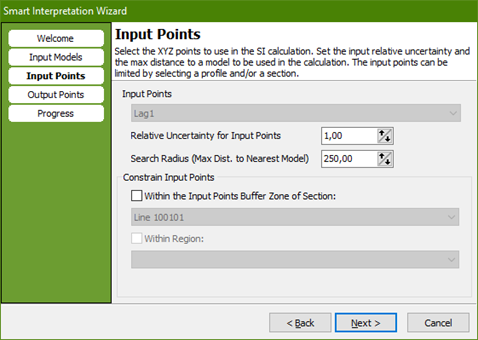
Input Points page: For the ’Interpretation mode’ (1) the input points are the points being edited and cannot be changed. For the ‘new XYZ point mode’ (2) select the points to use as input for the calculation. If no profile or region constrains are selected, all the points in the XYZ points object are used as input for the calculation. It is also possible to input points from a single profile only, i.e. the points visible when showing the profile. Only points within a region can be used too. If both a profile and region constrain is chosen only points that are ‘on’ the profile and also within the region are used. There need to be at least two input points fulfilling the constraints to do a calculation.
- The relative uncertainty for input points put an uncertainty on the points. 1 is a good starting value for this one.
- Search radius is the distance from a point to the nearest model.
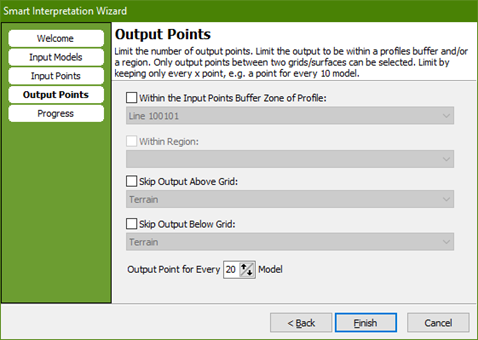
Output Points page: If no profiles, regions or grids are used, points are calculated and outputted at all model positions. These points can be limited by the ‘Output for every’. Like the input, a profile and region constrain can be selected. Furthermore, output points above and/or below chosen grids can be skipped.
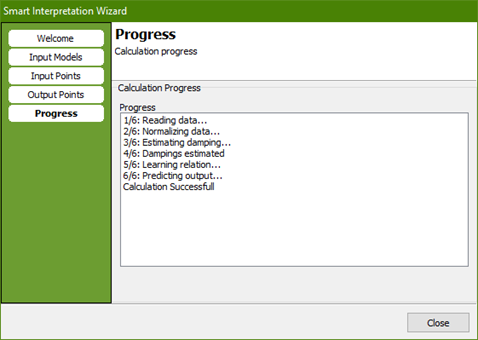
The following two pages are only shown for the ‘new XYZ point mode’ (2). For the ’Interpretation mode’ (1) the calculations start now and the ‘Progress page’ is shown (see below).
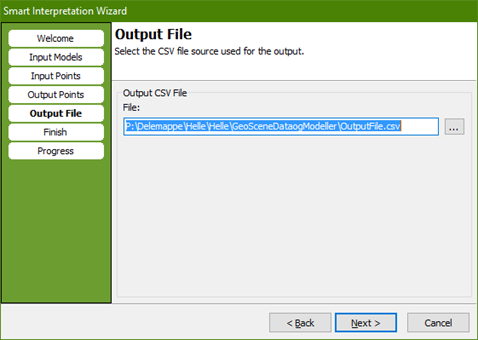
Output File page (‘new XYZ point mode’ (2) only): Select the output file, which will be the source for the XYZ point object created.
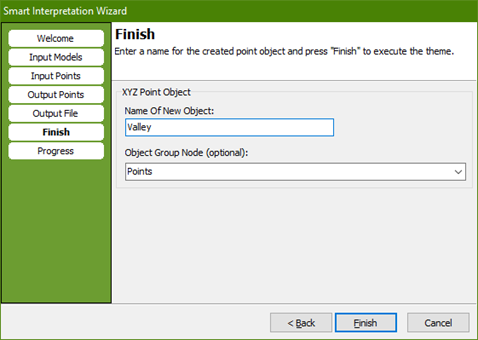
Finish page (‘new XYZ point mode’ (2) only): Write a name for the new XYZ point object and select a group (optional). Then press ‘Finish' to do create the theme and close the wizard.
