Aquifer vulnerability maps
This tutorial guides you through the process of creating aquifer vulnerability maps based on a hydrostratigraphic layer model or a lithology voxel model. It is required that the model includes at least one aquifer and one aquitard. The aquitard is in this tutorial considered as a protective layer due to contamination of aquifers found below. It is also possible to create aquifer vulnerability maps based on more than one aquifer and/or aquitard.
Reqiured data
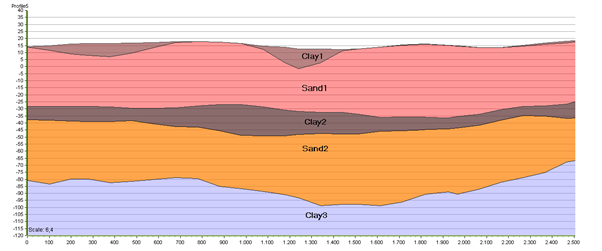
A hydrostratigrafic model or a lithology voxel model including at least one aquifer and one aquitard. This tutorial uses a hydrostratigrafic layer model with 5 layers: Clay1, Sand1, Clay2, Sand2 and Clay3. Sand2 is considered as the aquifer to be protected and clay1 and clay2 are the protecting aquitards.
Step 1. The Aquifer Vulnerability Maps Wizard
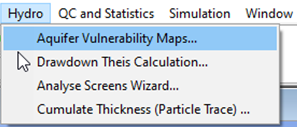
Go to Hydro → Aquifer Vulnerability Maps… and open the wizard. Press Next.
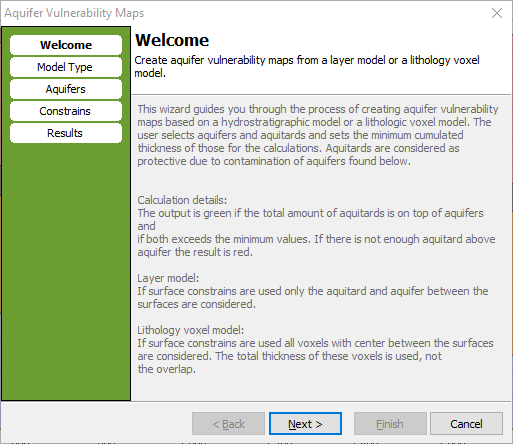
Select a model layer group or a voxel model with lithologies – this tutorial uses the layer model. Press Next.
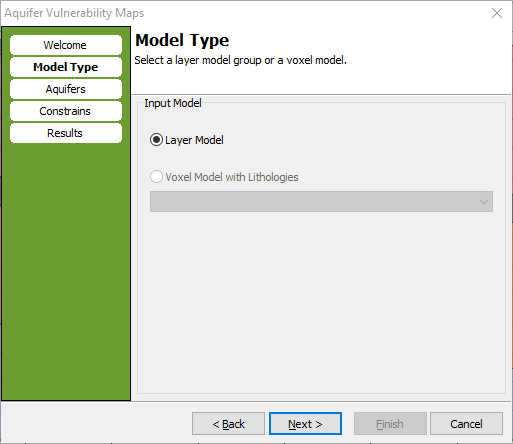
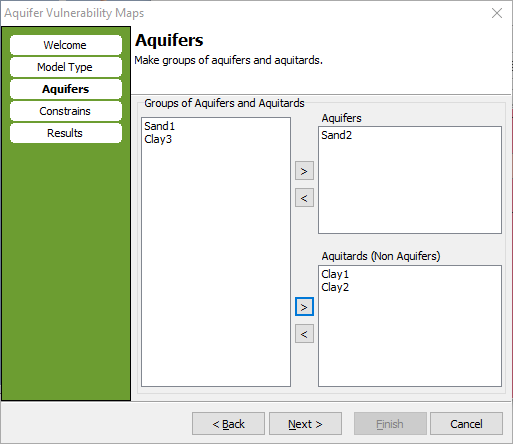
Select the aquifer(s) and aquitard(s). In this case sand2 is the aquifer and Clay1 and Clay2 the aquitards. Press Next.
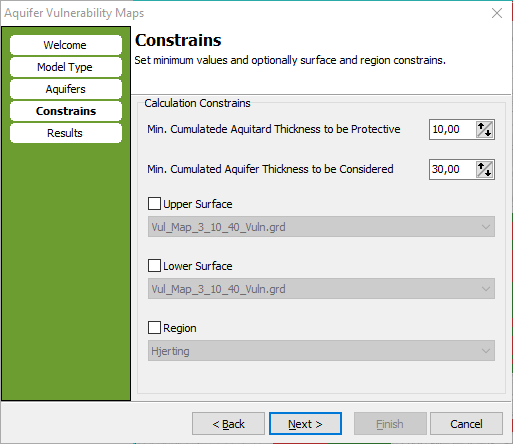
Set the calculation constraints. For Sand2 the minimum accumulated aquifer thickness to be considered is in this case 30 m. The minimum accumulated aquitard thickness to be protective is in this case 10 m, meaning that the sum of thickness of Clay1 and Clay2 should be minimum 10 m. It is also possible to set an upper and/or lower surface and/or region as constraints. Press Next.
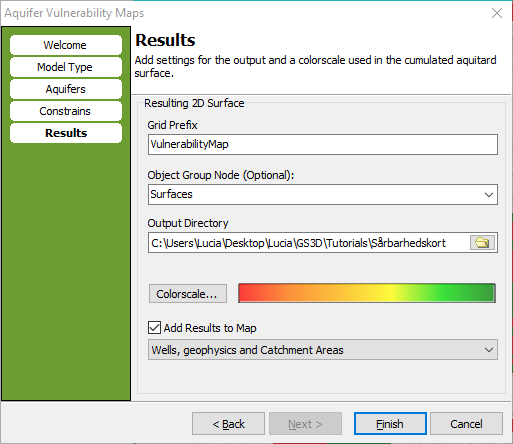
Add a name, the object group node, an output directory, a color scale, and tick on/off if you want the result automatically added to a map of your choice. Press Finish. The calculation is now processing.
Step 2. The Vulnerability Map
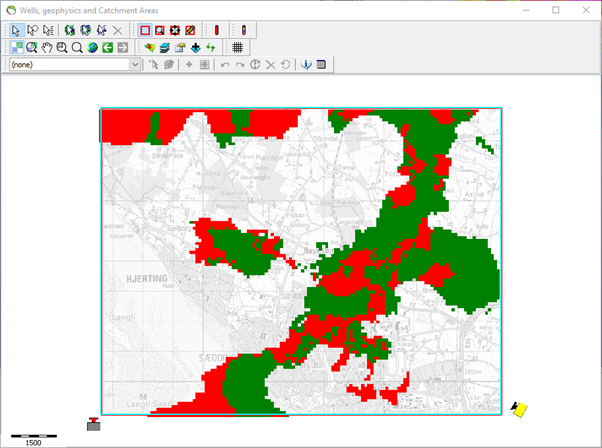
If you ticked on the automatic addition to the map, you are now able to see the results on the map window. The calculation automatically produces two maps; one named …_Vuln.grd (hereafter called the vulnerability map), and one named …_Thick.grd (hereafter called the thickness map). Both maps are added to the map window.

The vulnerability map has a 2-color-scale. The green areas show where the aquifer thickness is >30m AND the aquitards total thickness >10m. These areas are considered protected. The red areas shows where the aquifer thickness is >30m but the aquitards total thickness <10m. These areas are considered not protected. The un-colored parts of the map are where the aquifer thickness is <30m - defined as places where the thickness of sand2 is so small that it is not considered as an aquifer of interest.
Step 3. The Thickness Map
The thickness map shows the thickness of the protective layers (the aquitards), at places where the aquifer and the aquitards are thick enough to be considered. These places correspond to the green spots at the vulnerability map. Therefore, the minimun thickness in this case is 10 m which were defined in the wizard earliere. It is possible to change the color scales values and colors in the “layer properties” on the map.
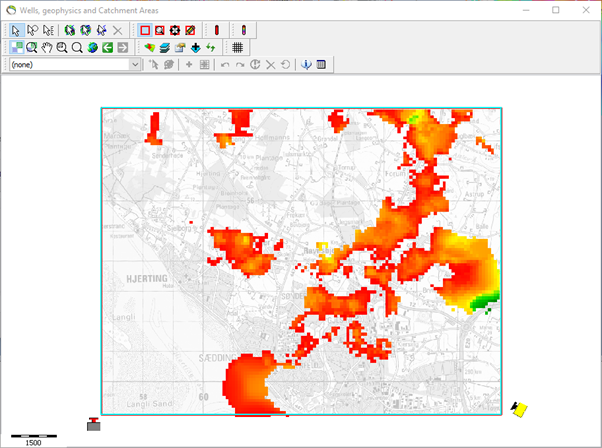
Please notice; If you add the two maps to another map window, please use the “GeoScene3D Dataset Based” in the “Add New Map Layer Wizard” to avoid 3D effects.
Step 4. Further calculations – combined maps
In the toolbox it is possible to combine two vulnerability maps.
Example: You have a model with 2 aquifers (aquiferA and aquiferB) and some protecting layers, and then creating two vulnerability maps showing the protection of aquiferA and aquiferB, respectively.
Combination 1 (Simple): You can combine these two vulnerability maps and produce a 4-color map showing (1) where both aquifers are protected (2) where only aquiferA is protected and aquiferB exist (3) where only aquiferB is protected and aquiferA exist and (4) where both aquifers are not protected. The undefined places will still show places where at least one of the aquifers are not defined.
Combination 2 (advanced): You can combine the two vulnerability maps and produce an 8-color map showing (1) where both aquifers are protected (2) where only aquiferA is protected and aquiferB exist (3) where only aquiferA is protected and aquiferB does not exist (4) where only aquiferA is not protected and aquiferB exist (5) where only aquiferB is protected and aquiferA exist (6) where only aquiferB is protected and aquiferA does not exist (7) where only aquiferB is not protected and aquiferA exist (8) where both aquifers are not protected. The undefined places will still show places where both aquifers are not defined.
