
This is an old revision of the document!
Interpretation Database QC
This tool is used for quality control of interpretation points. It can be used before and after modelling especially for checking if manually interpretation have caused errors somewhere.
Requirements:
- Layered model
- 1D geophysical data
Step 1. Running interpretation tool
1. See Setting Up Data for Modelling.
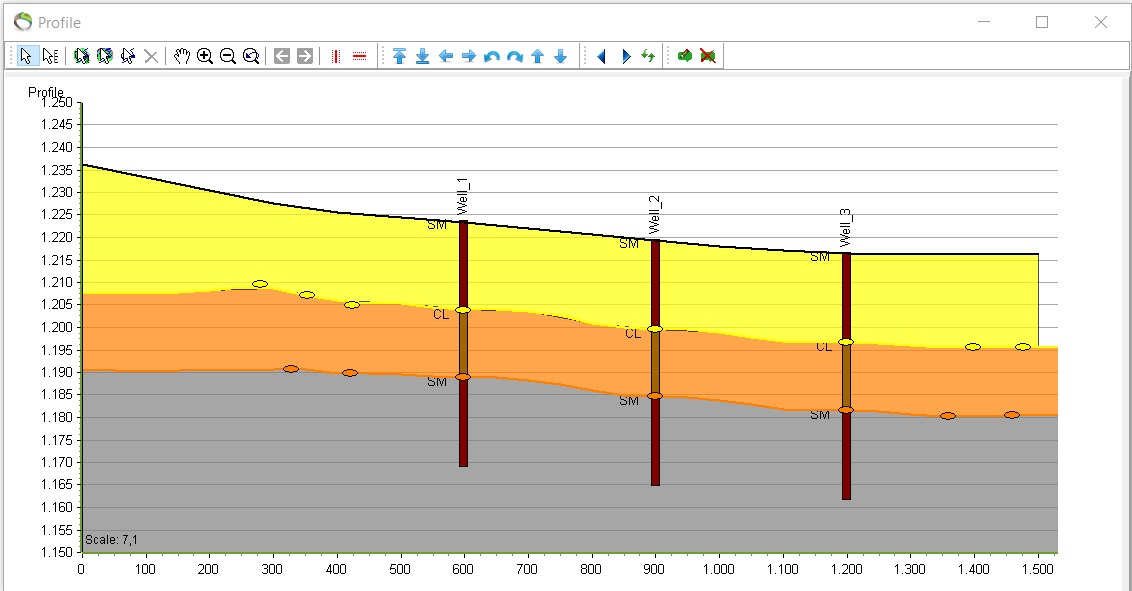
- Profile window with interpretation points connected to the boreholes.
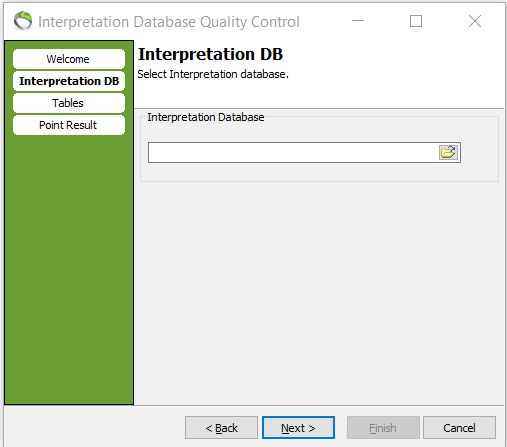
1. “QC and Statistics” menu –> “Interpretation Database QC…” –> next –> select the database file –> next.
2. Select one or more layers for point interpretation.
- The menu is called “tables” because information about the data points for all layers are stored in the MS Access DB in tables.
- In “Calculation Mode(s)” a box needs to be clicked to the left and right. The point dimension (XY or XYZ) and the extent of the QC - within one layer/table or across all layers/tables.

Step 2. Overlaps within each table
1. Overlapping points in one layer for a chosen dimension (XY or XYZ) can be controlled by clicking “Overlaps Within each Table”.
- The underlying picture shows two places in the layer boundary where points are overlapping in the XYZ dimension. The point legend describes with yellow color that two points are overlapping at each location.
- L1 XY intern + L1 XYZ intern - same output

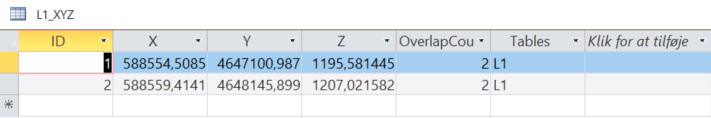
- To find the exact coordinates for the problematic points the MS Access DB can be opened. Correctly, the table consistently agree with two sets of points located at the same position both in the 2nd and 3rd dimension.

- It can be doublechecked
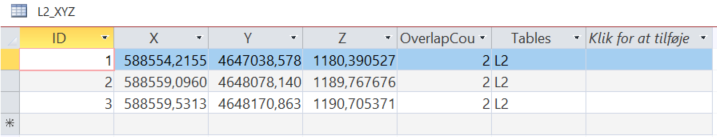
2. When the same settings are used on the next layer the underlying picture gives an output of 3 sets of overlapping points with 2 points at each location according to the legend.
- L2 XY intern + L2 XYZ intern - same output

- Again the coordinates can be checked in the MS Access DB.
Step 3. Overlaps across all tables
- Data points across more or all layers can also be controlled for overlaps.
1. Repeat step 1.2. for “overlaps across all tables”.
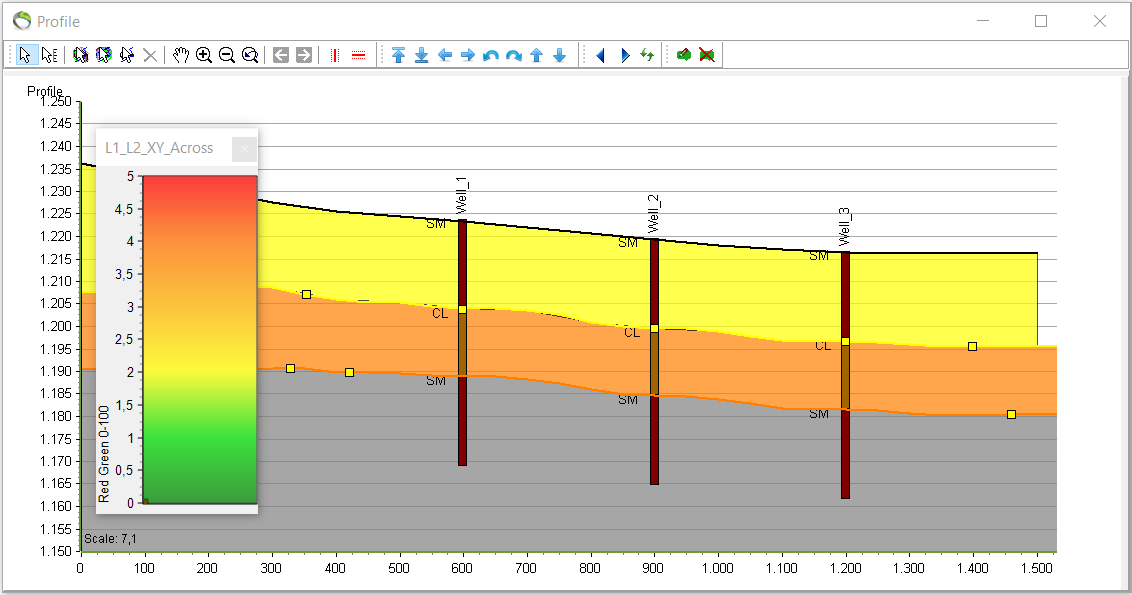
- In the profile below calculation has been performed across all layers for XY points. There are multiple locations with 2 overlapping points according to the legend.
- Note the difference between the profile in step 2.1. and the underlying profile. Here, three new overlapping points can be observed tied to the wells that wasn't apparant before in the profile from step 2.1. This difference can only be ascribed to a different vertical position but with identical XY coordinates. The most likely interpretation correlates to points snapped to the vertical oriented well for a layer boundary in another layer that results in overlapping XY points.
- In the next profile the calculation has been performed across all tables for XYZ coordinates. Compared to the profile from step 2.2. there are no new surprises hence all doublepoints can be ascribed to XY points within the layer.
