This is an old revision of the document!
Lithology of wells as a 3D grid
This is a description of how to show the lithology of wells as a 3D grid in GeoScene3D. In this case, the wells are loaded from Jupiter, the National Well database in Denmark.
Requirements
Module

Data
You can use any project that contains Wells, e.g., the project you created in one of the tutorial add Well data.
Step 1. Load wells
Load wells to GeoScene3D with the use of the “Add Data Wizard”.
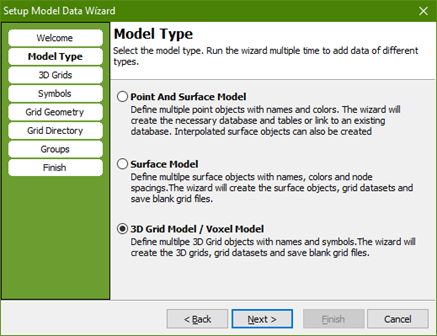
Select the “Setup data for modelling”,  , to open the “Setup Model Data Wizard”, select a new 3D Grid Model/Voxel Model and press next as illustrated in the below image:
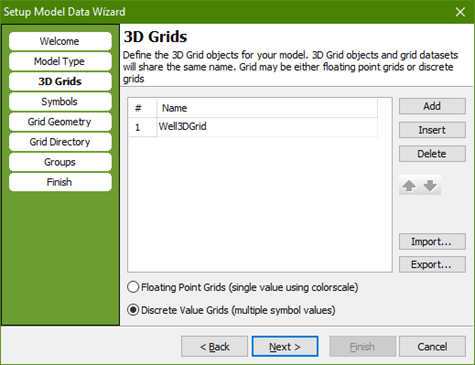
Define the 3D Grid object for your project, in this case it has to be a Discrete Value Grid, name the grid and press next as illustrated in the below image.
Select a list of symbols which represents the lithology in the wells and press next. In the case, the symbol list is taken from Jupiter, the National Well Database in Denmark.
TIP: You can import/export your own symbol list in the Symbol list editor.

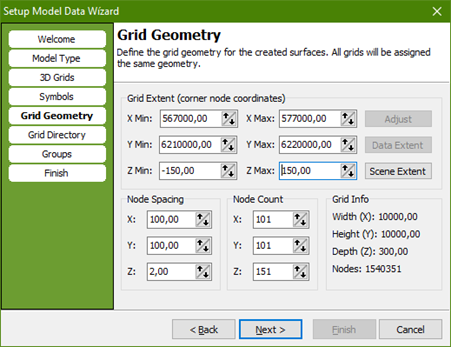
Define the grid geometry as scene extent or as a given model area and press next as illustrated in the below image.
Define a grid output directory and press next. Select the target group object in the object manager for the created object and press next and finish.
Step 2. 3D Grid
Right-click on the 3D Grid, in this case named “Well3DGrid”, select “Start Edit Session” and the Grid Editor Window opens automatically as illustrated in the below image.
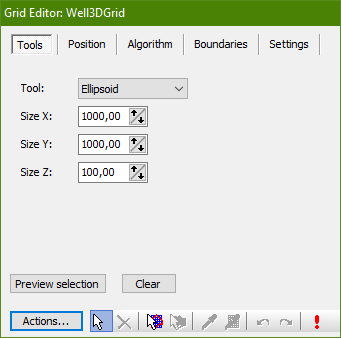
Select “Grid Operations” under “Actions” and the grid operations window opens automatically as illustrated in the below image. Check the Fill From Wells button, select the available wells and define the search radius. (If “Grid Operations” can’t be selected be sure that the data is in the scene extent.)
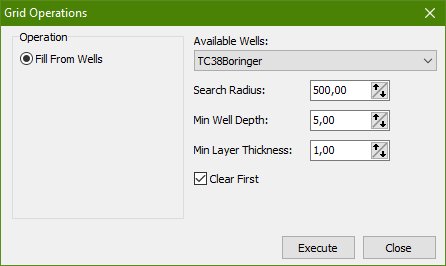
Press Execute, close and stop the edit session.
Result
As default, the 3D grid shows in the 3D window as nodes as illustrated in the below image.
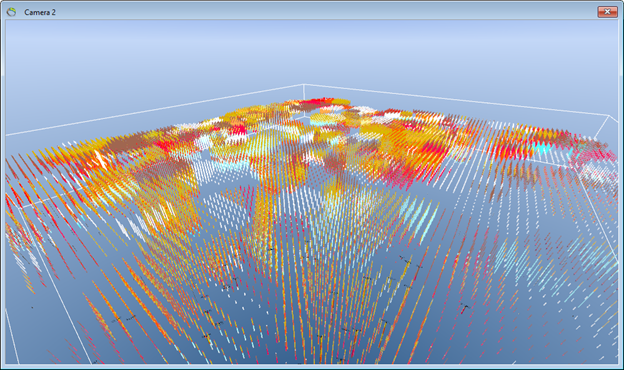
The 3D grid can be illustrated as slices, for example as horizontal slices as illustrated in the below image.
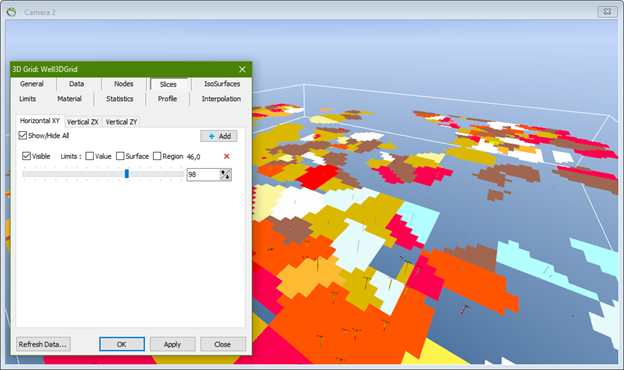
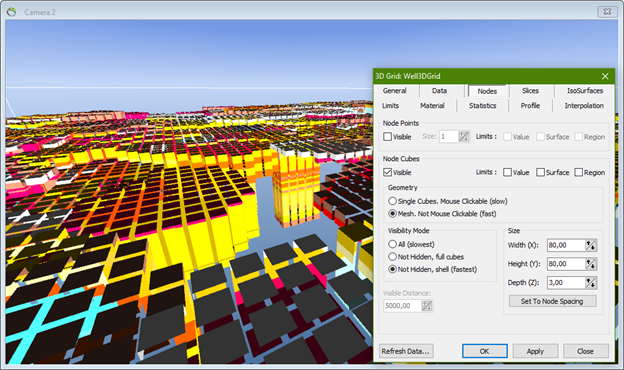
The 3D grid can be illustrated as node cubes as illustrated in the below image. Define the size of the node cubes as “Set To Node Spacing”.
