This is an old revision of the document!
Editing 3D Grids (Voxel Modeling)
This tutorial describes how to create a geological model with the use of voxels in GeoScene3D. The model operates with three pre-defined 3D grid objects (Lithology, Probability and Geological Era). These are made for modeling the lithology, the probability of the interpretation and finally the geological era.
Requirements
Data
NOTE: This tutorial is based on data from Denmark and Danish Geology. You can define your own list of symbols and the geological settings at your modeling location.
Step 1. Preparations
1. Open a new project, e.g. the one you created in the tutorial, Creating a New Project.
2. Right-click the “Objects” key node in the “Object Manager” and select the “Setup Model Data Wizard”.
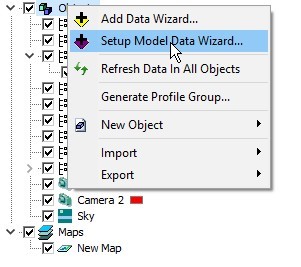
Step 2. Setup Model Data Wizard
The wizard prepares and adds multiple datasets for modeling; in this tutorial we will create three 3D discrete value grids for the voxel modeling.
1. Open the wizard.
2. In the “Model Type” page, select the “3D Model/Voxel Model”.
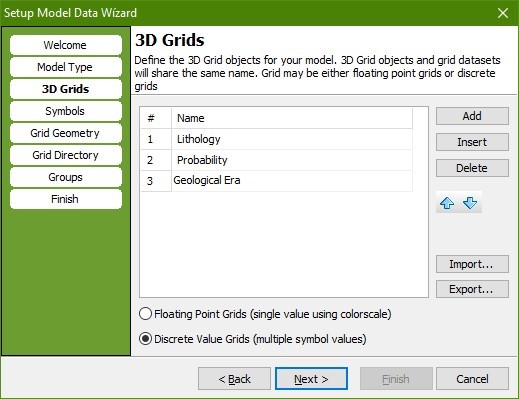
3. In the “3D Grids” page, add three new 3D grids and give them following names:
    Lithology\\
    Probability\\
    Geological Era
4. Select the “Discrete Value Grids” radio button at the bottom of the page 2. Press “Next”.
5. In the “Symbols” page, you setup the list of symbols for all three 3D grids. The default list of symbols is taken from Jupiter, The National Well Database of Denmark.
6. Press “Select/Edit Symbols…” to edit the list of symbols 3.
7. When you have finished the list of symbols, press “Next”.
Note: In the Model Data Setup Wizard, all three 3D grids get the same list of symbols. You can define a unique list for each 3D grid afterwards, see step 3.2.
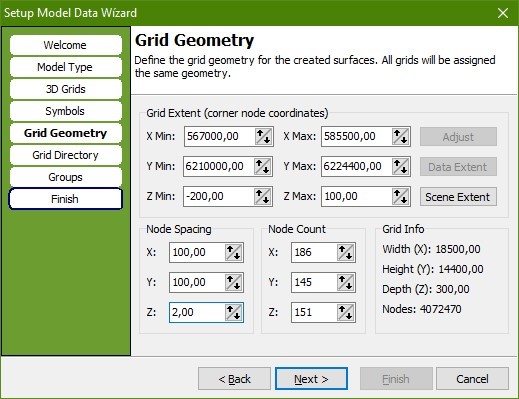
In the “Grid Geometry” page, the grid geometry is defined.
8. In this tutorial we use the Scene Extent. Press the “Scene Extent” button.
9. Specify the vertical grid extent as:
   Zmin = -200\\
   Zmax = 100\\
10. Specify the node spacing as:
   X = 100\\
   Y = 100\\
   Z = 2\\
11. When completed, your vertical grid and node spacing settings should look as below. Press “Next”.
12. In the “Grid Directory” page, select the output directory for all three 3D grids. In this tutorial, the Grid File Output Directory is C:\Temp.
13. Press “Next”.
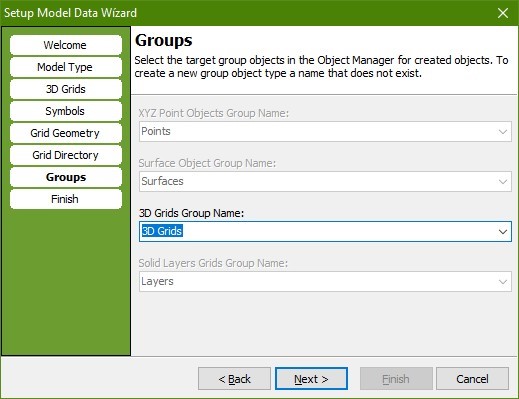
In the “Groups” page, you can, for the created grids, select the target group objects in the object manager.
14. Use 3D Grids, The 3D Grids Group Name is by default “3D Grids”. Press “Next”.
15. The “Finish” page shows a summary of the created objects, datasets and files. Press “Finish”.
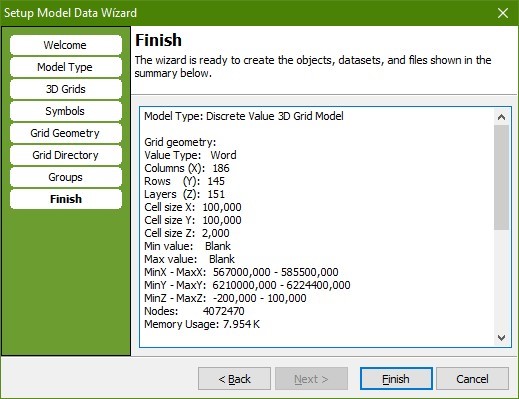
16. The three 3D grids (Lithology, Probability and Geological_Era) are automatically loaded to the project and are ready for voxel modeling.
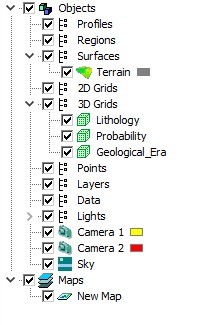
Step 3. Select a list of symbology for each 3D grid
Going through the “Setup Model Data” wizard, by default, the three 3D grids are given the same list of symbology. Step 3 in this tutorial describes how to change the list of symbols for each 3D grid.
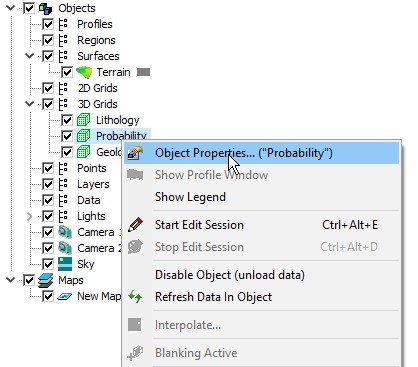
1. In the Object Manager, highlight and right-click the 3D grid “Probability” and select “Object Properties…(“Probability”)”.
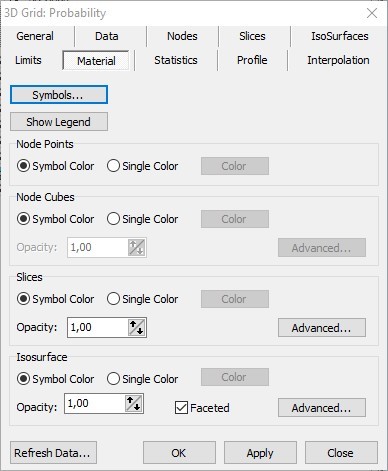
2. In the Object Properties box, select the “Material” tab and press “Symbols”, this will start the Symbol List Editor.
3. Press “Clear” and add three new rows representing the probability of the geological interpretation.
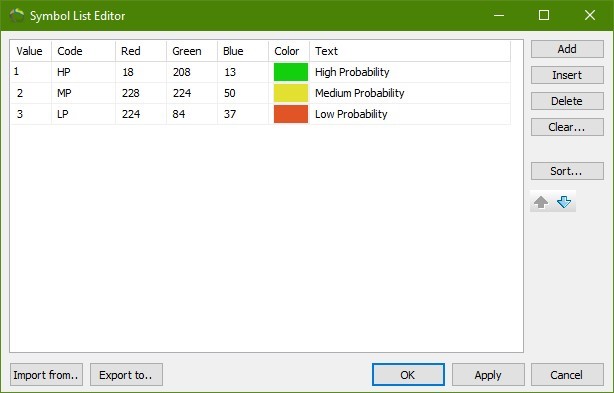
Figure 10: Three rows are typed in the Symbol List Editor. To change the color, click the color box in the color column.
4. Using the same approach as in step 3.1-3.3, you now add symbols for the 3D grid “Geological Era”, see figure 11.
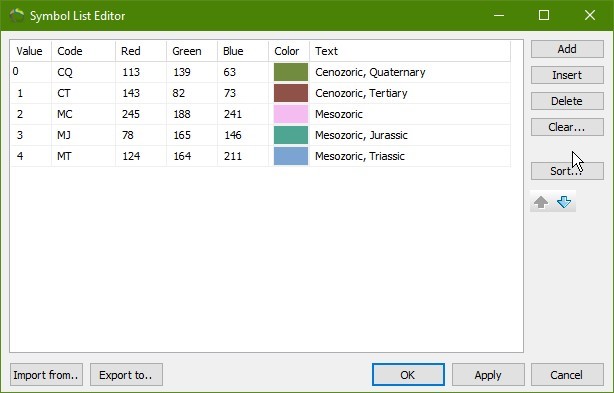
Figure 11: Five rows are typed in the Symbol List Editor. To change the color, click the color box in the color column.
Step 4. Start an edit session and apply edits in 3D
The procedure is the same in all editable 3D grids. The lithology 3D grid is used in this example.
Start an edit session:
1. Select “Lithology” in the drop-down list in the main toolbar, see figure 12.
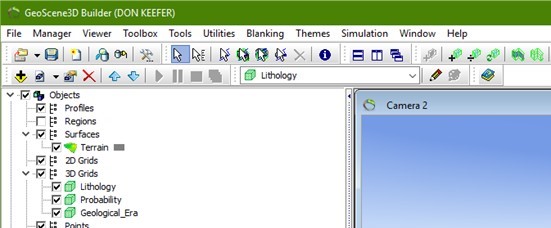
Figure 12: Select the 3D grid, in the dropdown list, you want to edit.
2. Press the “Start Edit Session” button  , next to the dropdown list.
3. This opens the “Grid Editor” and starts the edit session, see figure 13.
NOTE:
The editing shape appears in 3D as a floating geometry and in the map as a circle. By default, the editing shape is an ellipsoid, the shape and size of the editing shape is configurable in the “Grid Editor” window under the “Tools” tab, see figure 13.
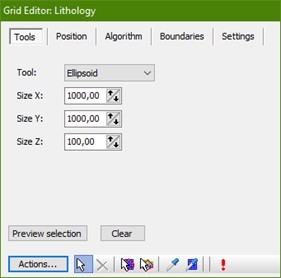
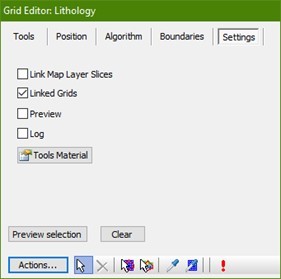
Figure 13: The editing shape in 3D is configurable in the “Grid Editor” window. Check mark the “Linked grids” under “Settings” tab and the “linked grids” editor is activated.
4. Check mark the “Linked Grids” in the grid editor window and the linked grids editor opens, see figure 13 + 14.
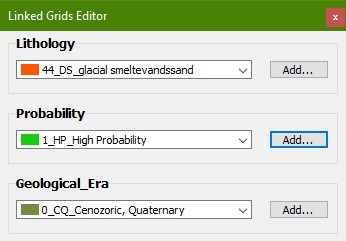
Figure 14:The Linked Grids Editor window iIllustrates the selected symbols that will be assigned to the 3D grid nodes.
5. Under Lithology, select “44_DS_glacial smeltevandssand” (danish terminology for sand) from the dropdown menu.
6. Under Probability, select “high” from the dropdown menu.
7. Under Geological Era, select “Cenozoic, Quaternary” from the dropdown menu.
Step 5. Apply edits in 3D.
Now you are ready to apply edits in the 3D grids. The editing shape can be configured in the “Grid Editor” window and in this tutorial, the editing shape has following parameters, see figure 13:
         X = 1000\\
         Y = 1000\\
         Z = 100\\
1. To move the editing shape, press the “Move Grid Edit Tool” button  , in the “Position” tab in the Grid Editor.
2. Drag the editing shape to any position as shown in figure 15.
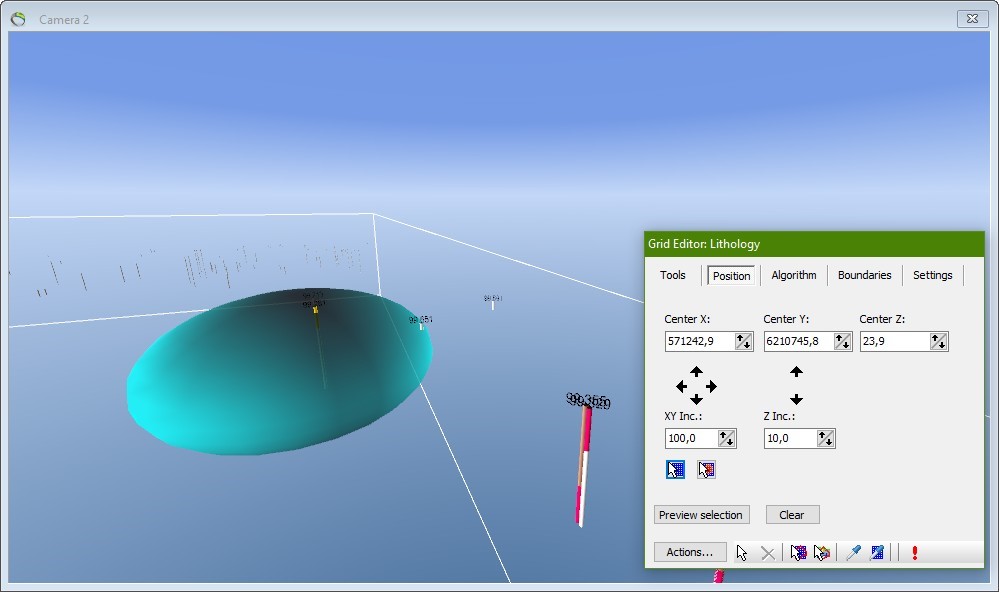
Figure 15: The editing shape is shown in 3D. The shape is configured in the “Grid Editor” window and in this case configured as an ellipsoid. In this figure, The “Move Grid Edit Tool” button is under the “position” tab in the Grid Editor and the “Apply changes to grid” button is always in the bottom the the Grid Edition illustrated as a red exclamation mark.
3. Press the “Apply changes to grid” button  , see figure 15.
4. To see the applied changes, move the editing shape to another position, see figure 16.
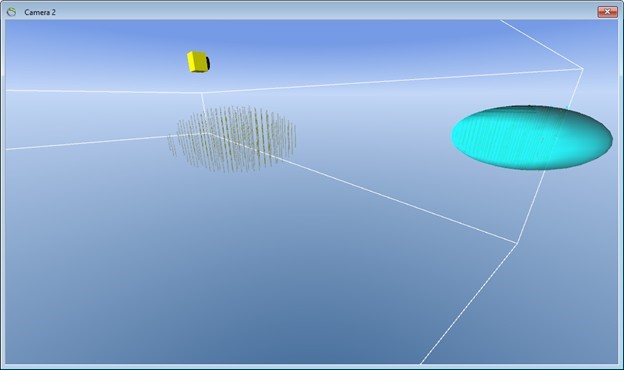
Figure 16: The edits applied are, by default, shown as node points in 3D space.
5. To stop the Edit session, press the button in the main tool bar.
Step 6. How to visualize node points as node cubes
The procedure is the same in all editable 3D grids. The lithology 3D grid is used in this example.
1. In the Object Manager, Right-click the 3D Grid object “Lithology” and select “Object Properties…”, see figure 8.
2. Press the “Nodes” tab, see figure 17.
3. Set the following properties:
- Check “Node Cubes” to be “Visible”.
- Geometry to “Mesh. Not Mouse Clickable (fast)”
- Visibility Mode to “Not Hidden, shell (fastest)
4. For Size, press the button “Set To Node Spacing”
   Width (X) = 98\\
   Height (Y) = 98\\
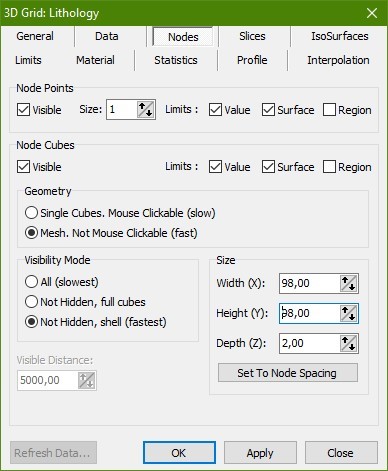
Figure 17: Node cube settings for the node points in 3D
5. Press “OK”, see figure 18.
TIP
Make the width and height of the node cubes a couple of units less than the node spacing.
This makes the node cubes appear as boxes in 3D, see figure.
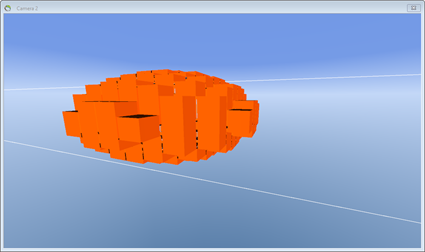
Figure: The lithology grid shown in 3D as node cubes. The red color represents the lithology sand.
Repeat step 1 through 3 to visualize the edits as nodes cubes for the other two 3D grids, “Probability” and “Geological Era”, see figure 18.
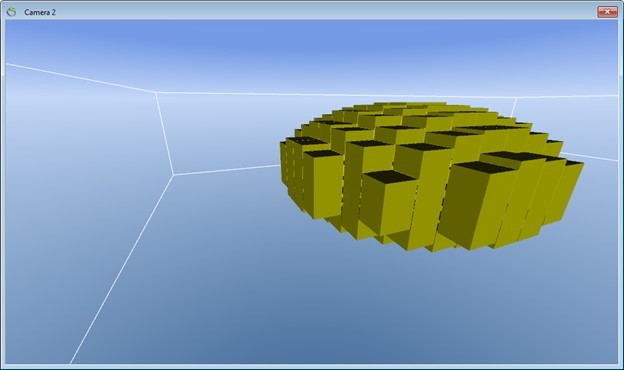
Figure 18: The “Geological Era” grid shown in 3D as node cubes. The green color represents the geological era Cenozoic, Quaternary.
Step 7. Exercises
A) In this exercise you will learn how to apply further edits to the 3D grids.
1. Select “Geological Era” in the drop-down list in the main toolbar, see figure 11.
2. Press “Start Edit Session” shown as a pencil  . By default, the Geological Era is in this exercise “Cenozoic, Quaternary”.
3. To move the editing shape, press the “Move Grid Edit Tool” button  , in the “Grid Editor” window.
4. Press the “Apply changes to grid” button 
Go through steps 7.1 to 7.4 a couple of times to apply further edits to the 3D grid.
B) In this exercise, you will learn how to change the Geological Era to Mesozoic, Cretaceous.
1. Checkmark the “Linked Grids” in the grid editor window and the linked grids editor opens, see figure 13.
2. Under Geological Era, select “Mesozoic” from the dropdown menu.
3. Now, go through steps 7.A.3 to 7.A.4 to apply further edits to the 3D grid, see figure 19.
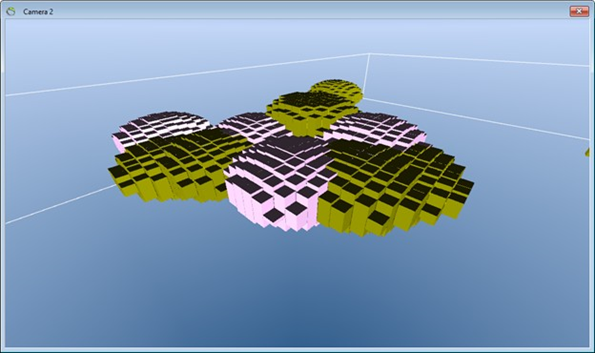
Figure 19: In 3D, the “Geological Era” grid has been edited as Cenozoic, Quaternary (green) and Mesozoic, Cretaceous (light red).
4. To stop the Edit session, press the button  , in the main tool bar.
Tip
If the edited nodes are invisible it may be due to the limit settings. Right-click the 3D
grid object in the object manager, Select “Objects Properties…”. Select the “Limits, values” tab and increase the max node value interval, see figure.
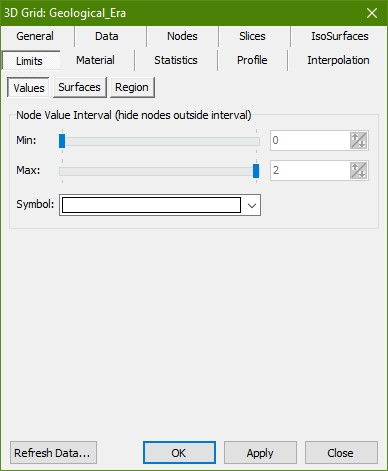
Figure: shows where to set the node value interval.
Step 8. Apply edits in the profile window
Now you are ready to apply edits in the profile window.
1. Create and open a profile window. See the “Digitizing Profiles” tutorial.
2. Add wells to the GeoScene3D project. See the “Add Wells” tutorial.
3. Select the 3D grid “Lithology” in the drop-down list in the main toolbar, see figure 12.
4. Press “Start Edit Session” shown as a pencil  .
.
5. To move the editing shape, press the “Move Grid Edit Tool” button  , in the “Grid Editor” window and press the position in the profile window.
6. Press the “Apply changes to grid” button  , see figure 20.
7. To see the applied changes, move the editing shape to another position in the profile window.
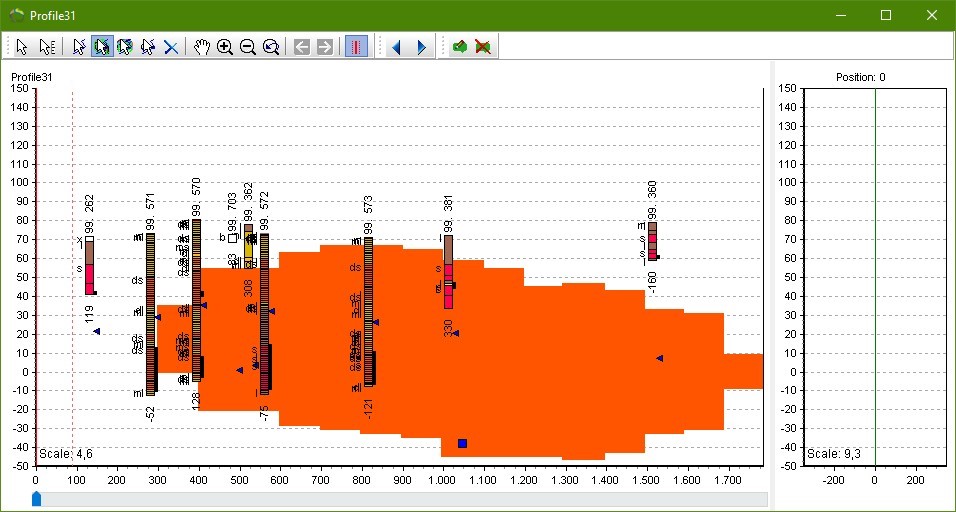
Figure 20: The profile window.
Step 9. Exercises
A) In this exercise you will learn how to apply additional edits to the 3D grids in the profile window.
1. Open the “linked Grids Editor, see 4.4 and figure 21.
2. Under Lithology, select “309_L_Ler, mergel” (danish terminology for clay) from the dropdown menu.
3. Under Probability, select “Medium” from the dropdown menu.
4. Under Geological Era, select “Mesozoic, Cretaceous” from the dropdown menu.
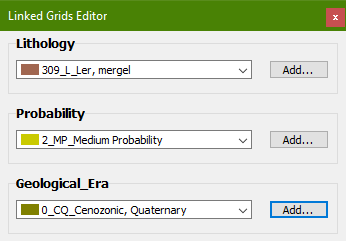
Figure 21: The selected symbols that will be assigned to the profile window nodes.
5. To move the editing shape, press the “Move Grid Edit Tool” button  , in the “Grid Editor” window and press the position in the profile window.
6. Press the “Apply changes to grid” button  .
.
7. To see the applied changes, move the editing shape to another position in the profile window.
B) In this exercise you will learn how to apply additional edits to the 3D grid in the profile window where you use surface boundaries to “cut off” voxels, in this case above the terrain surface.
1. In the Grid Editor window, set the “Surface Boundaries - Below” to “Terrain” in the dropdown menu, see figure 22.
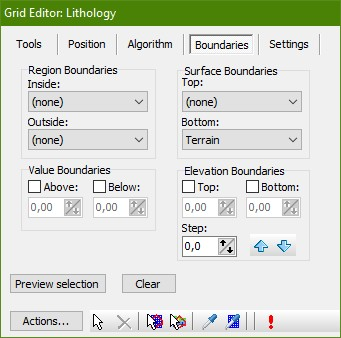
Figure 22: Shows the “Surface Boundaries” settings.
2. To move the editing shape, press the “Move Grid Edit Tool” button  , in the “Grid Editor” window and press the position in the profile window.
3. Press the “Apply changes to grid” button  , see figure 23.
4. To see the applied changes, move the editing shape to another position in the profile window.
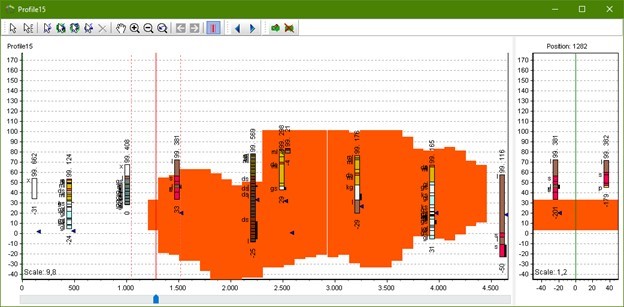
Figure 23: The profile window with the applied edits.
Tip
If the edited nodes are invisible it may be due to the limit settings. Right-click the 3D
grid object in the object manager, Select “Objects Properties…”. Select the “Limits, values” tab and increase the max node value interval, see figure.
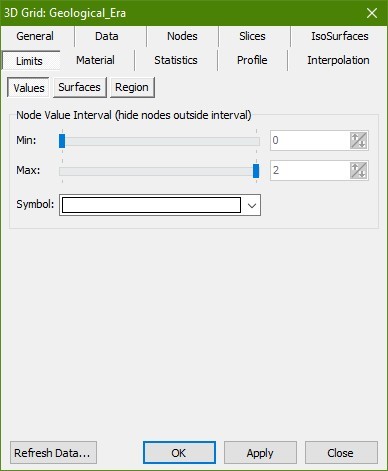
Figure: Illustrates where to change Max limit settings.
5. To stop the Edit session, press the button  , in the main tool bar.
6. In the object manager, turn on/off the two other 3D Grids. If the grids are invisible, it may be due to the limit settings. See the above tip box.
Step 10. Apply edits in the map window
Now you are ready to apply edits in the map window.
1. Load the 3D grids to the 2D map. See the “Add Map Layers” tutorial. If the grids is not shown in the map window click on “Layer Properties” in the Layer Manager. Drag the Index slider to another position and the grids will appear, see figure 24.
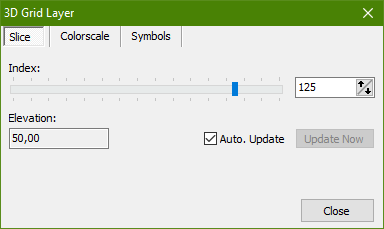
Figure 24: Slider for the grid
2. Select “Geological Era” in the drop-down list in the main toolbar, see figure 12.
3. Press “Start Edit Session” shown as a pencil  .
.
4. Open the “linked Grids Editor, see 4.4 and figure 25.
5. Under Lithology, select “143_CK_trias kalksten” (Danish terminology for limestone) from the dropdown menu.
6. Under Probability, select “Medium” from the dropdown menu.
7. Under Geological Era, select “Mesozoic, Triassic” from the dropdown menu.
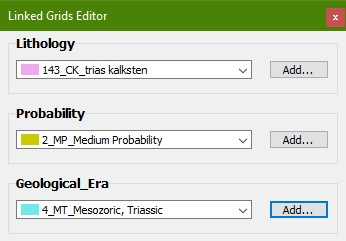
Figure 25: Illustrates the selected symbols that will be assigned to the map window nodes.
Now you are ready to apply additional edits in the map window. The editing shape is the same as defined in step 4. In the “Tool Position” frame, enter Center Z = 5, see figure 26.
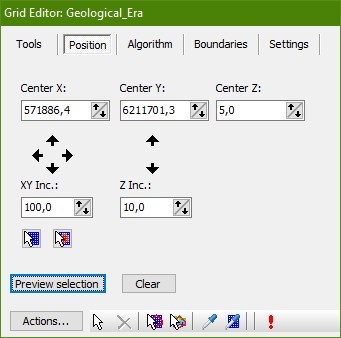
Figure 26: Shows the “Tool Position” settings in the map window.
8. To move the editing shape, press the “Move Grid Edit Tool” button  , in the “Grid Editor” window and press the position in the map window.
9. Press the “Apply changes to grid” button  , see figure 26.
10. To see the applied changes, move the editing shape to another position in the map window.
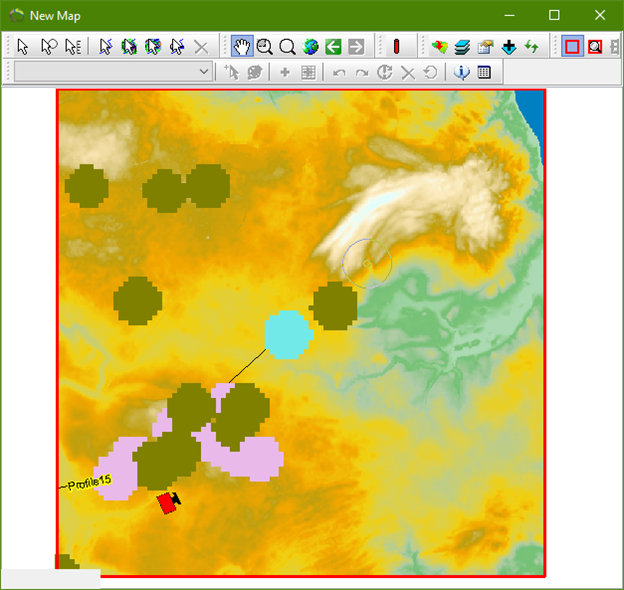
Figure 27: Shows the map window where the applied edits is illustrated.
11. To stop the Edit session, press the button  , in the main tool bar.
Tip
If the new edited geometry is invisible in the map window, it may be due to “Slice” index settings.
1. Open the map layer manager.
2. Mark and Right-click the 3D grid layer in the map layer manager.
3. Select “Layer Properties…”.
4. Select the “Slice” tab.
5. Increase the Elevation value, see figure.
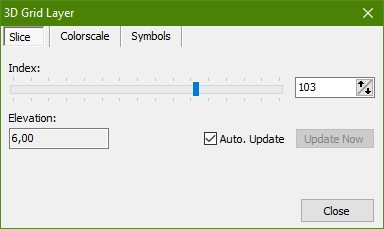
Figure: Mouse-click the bar below index to turn slices of the 3D grid up and down.
