This is an old revision of the document!
3D Grid visualization with defined limits
This tutorial shows how to visualize a specific part of the 3D grid on any arbitrary “two-point profile” line.
Requirements
- Open 3D grid project (.grd3)
Step 1. Create a "two-plot" profile
1. See Add (multiple) 3D grid.
2. Use the “profile digitizer tool”  to manually create a “two-plot” profile across the terrain in the 3D window.
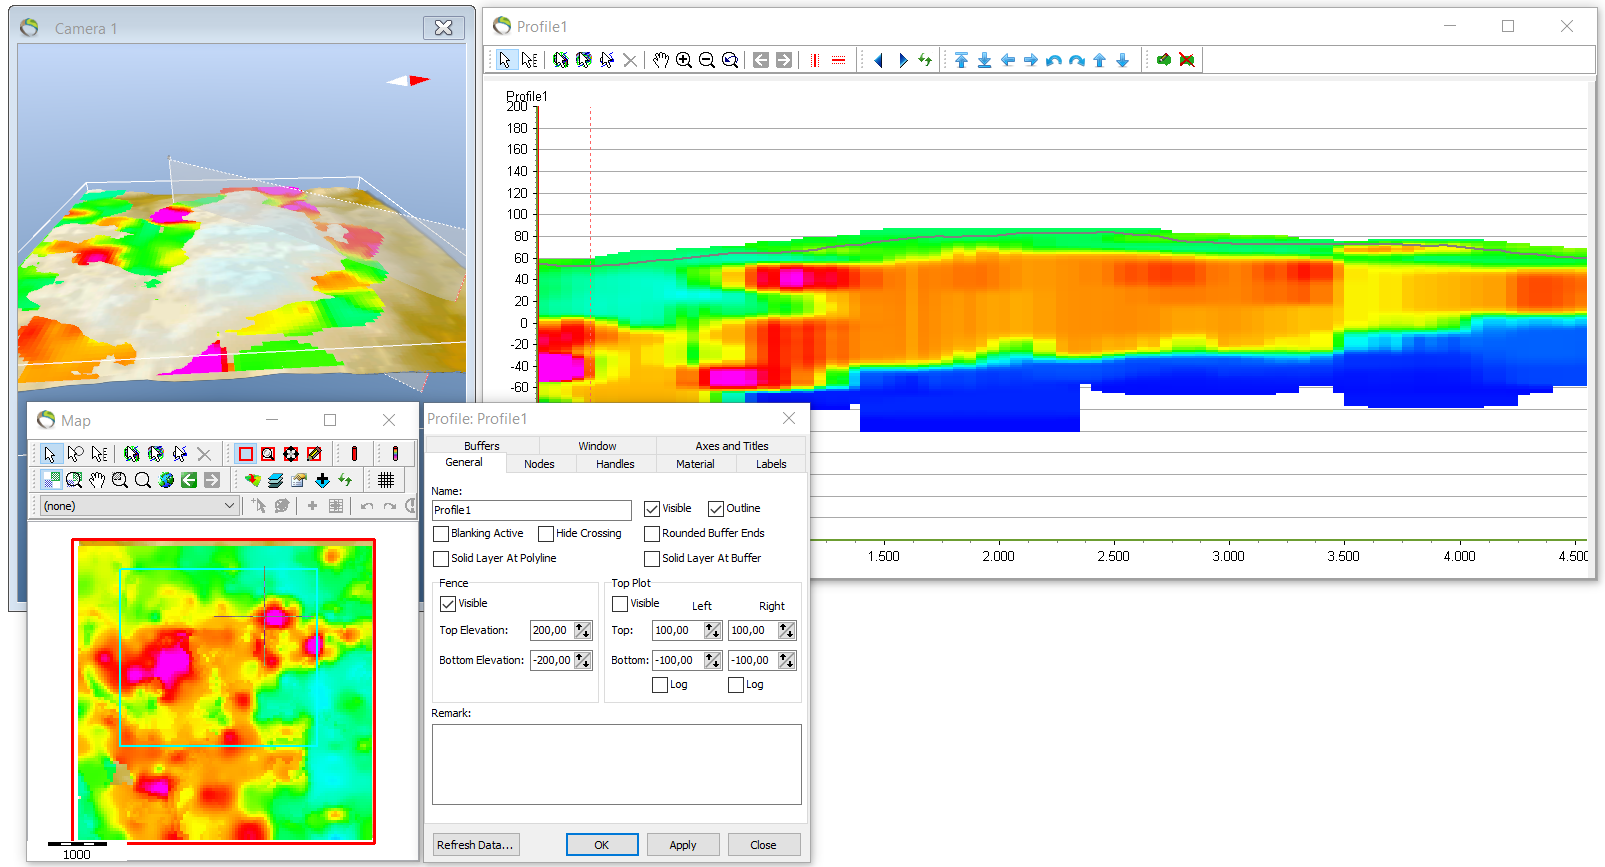
- When created, notice the default elevation setting on the profile is way above the terrain in the 3D window. Use your information about the area - in this case Denmark - and then you will know that the highest point in Denmark is no more than 175 meters.
3. Rightclick “Profile1” in object manager –> “object properties” –> “General” –> “Name: Profile1” –> Correct the elevation profile e.g. “top elevation: 200” and “bottom elevation -200”.
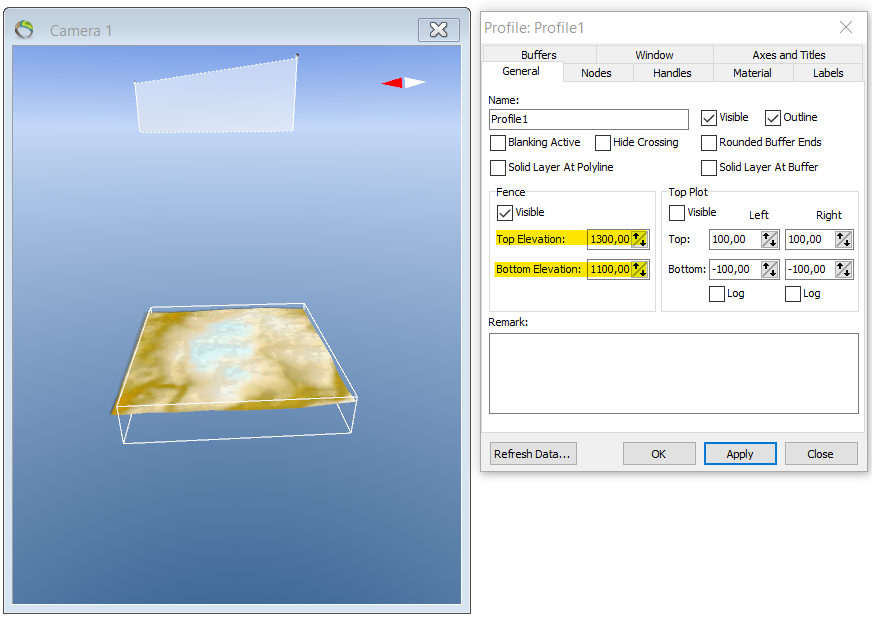
- After the profile has been lowered to the interval between -200 to 200 meters the 3D data can be visualized in the profile. See next picture.
Step 2. Import/export coordinates
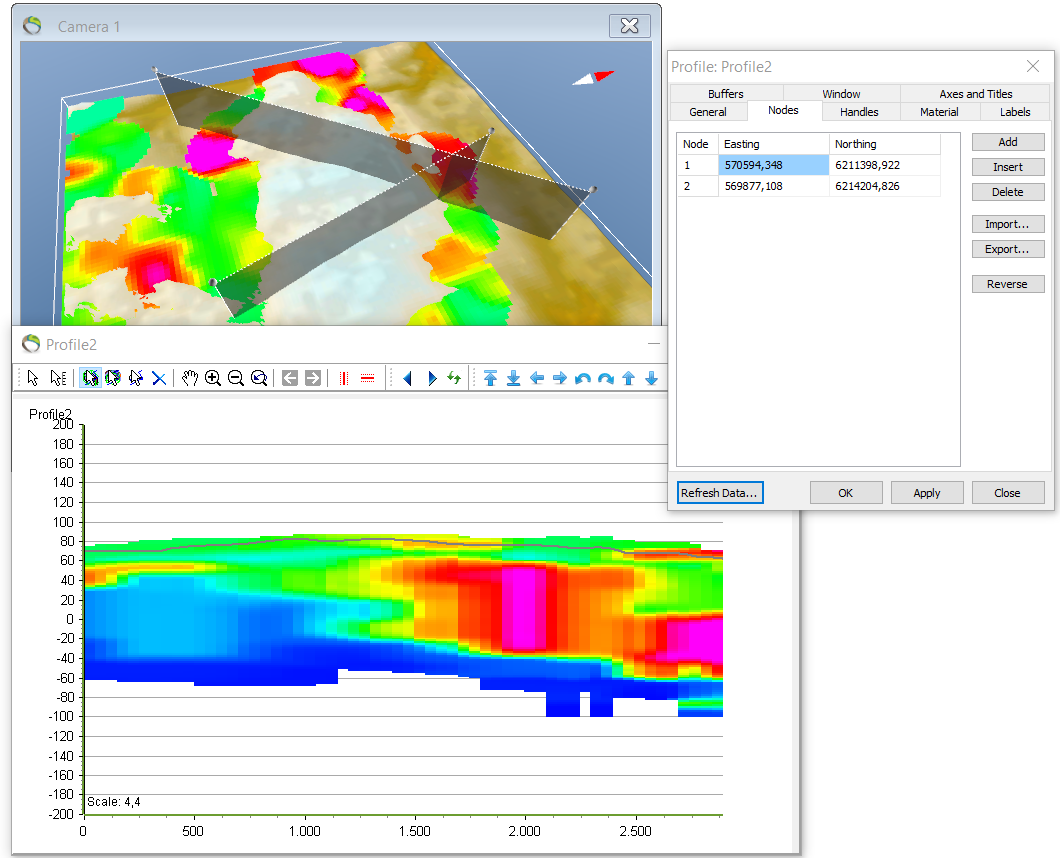
1. For Profile1 “object properties” –> “nodes” menu –> the “import” button can be used to import a (.CSV) file with coordinates for adjusting the profiles to a specific desired placement on the map.
- Vice versa the manually dragged profile coordinates can be exported to a new (.CSV) file by clicking the “export” button.
Step 3. Visualize the profile
1. To visualize the profile transection go to object manager and rightclick “profile1” –> “Show profile window”.
- The profile with fixed limits can be moved in any direction on the map with the toolbox in the profile window
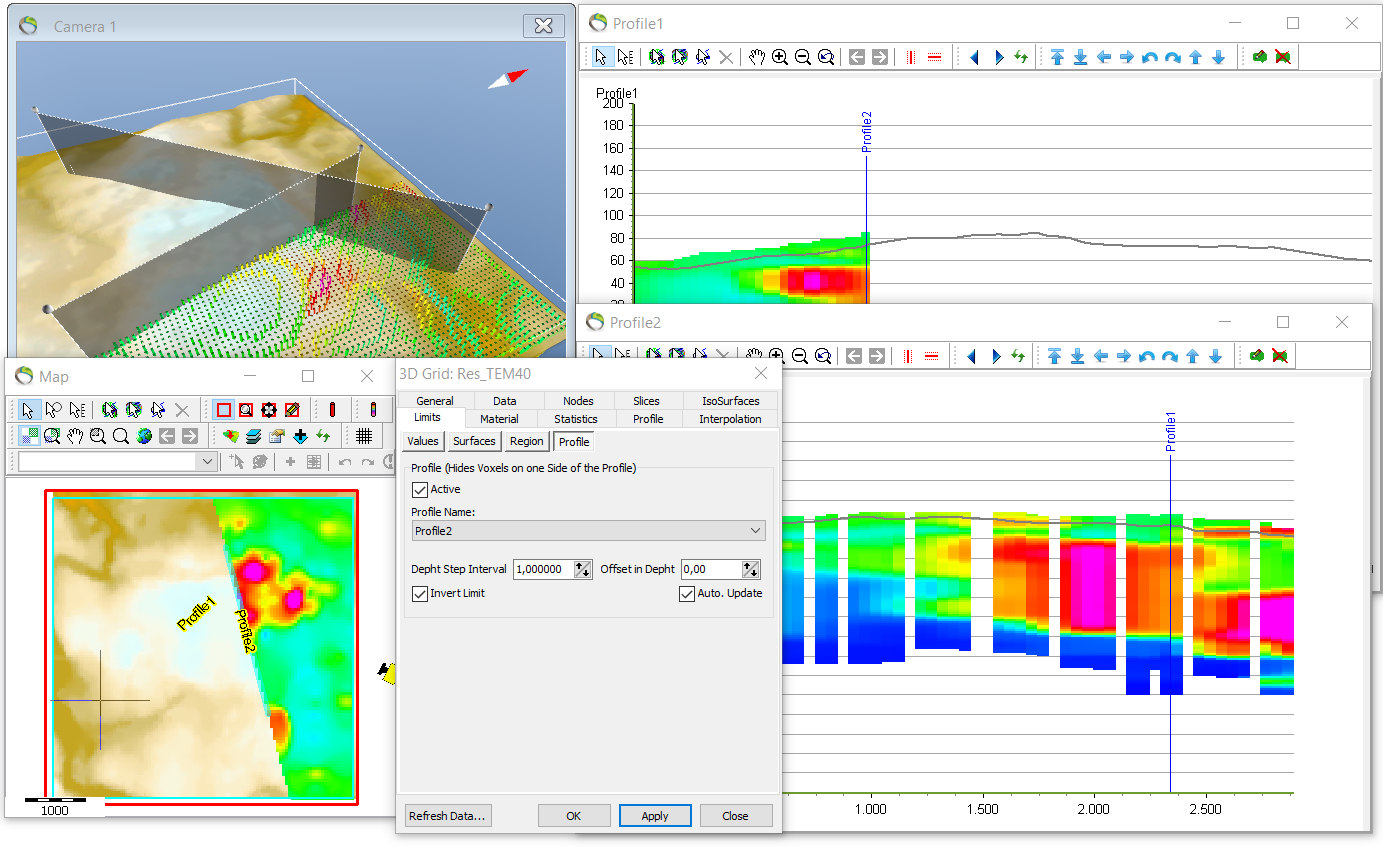
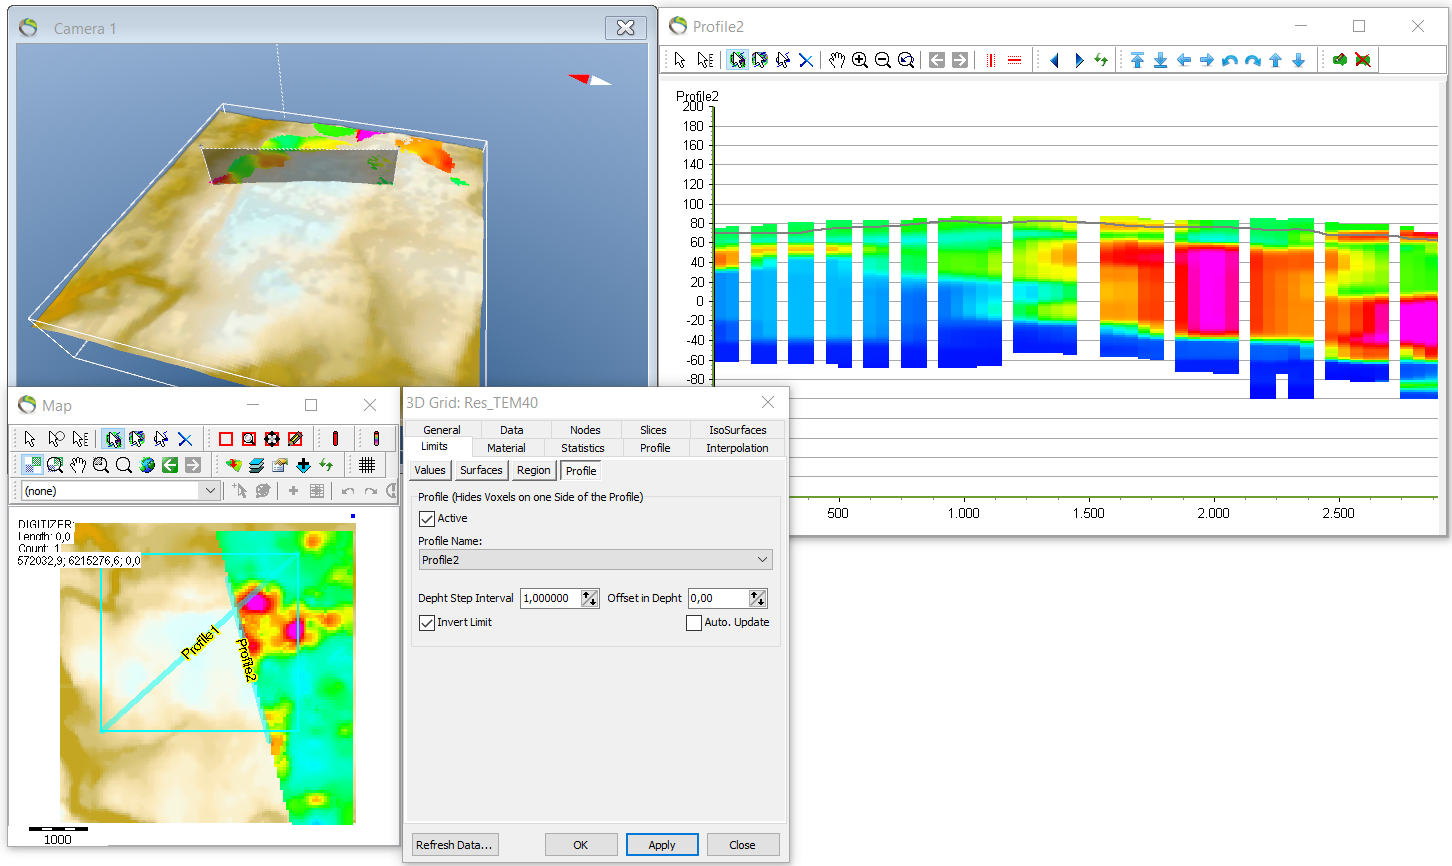
- The 3D grid visualization can also be limited along the profile line in map view. In the next picture along “Profile2”.

2. Rightclick your 3D grid in object manager –> “object properties” –> “Limits” –> “Profile” –> click “Active” –> choose “Profile2”.
- With this setting you will only have visualization of the dataset on one of the sides of the profile on the map.
- This setting also prevent the hidden datapoints to influence the visualized profile e.g. by enhancing the buffer hence the “holes” in the profile. Only datapoints on the visible side can assist when enhancing the buffer.

- The map visualization hence the profile can also be inverted.
3. Repeat step 2.2 –> click “invert limit”.
4. NB if there are problems with missing data on the profiles go to object manager –> right click the 3D grid –> “object properties” –> “profile” menu –> and check if the “percent fill” is 100 and “opacity” 1.
- If both profiles are activated at the same time in the object manager - and if they intersect - only a part of e.g. profile1 will be visible. The visible part of profile1 is before the intersection point with profile2 and the hidden part is after the intersectcion point. See the picture below.
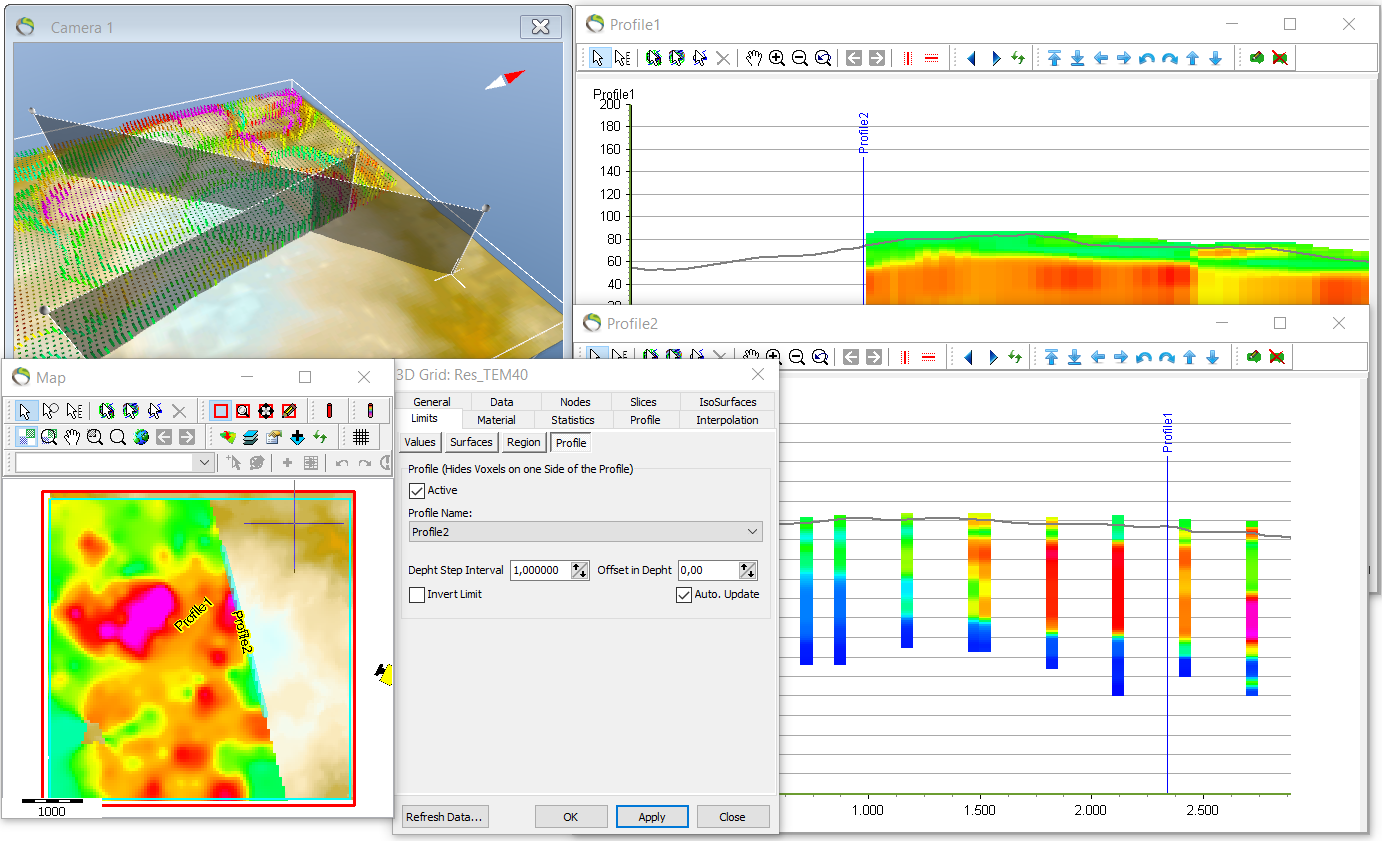
- See picture below for the inverted case.
Step 3. Results