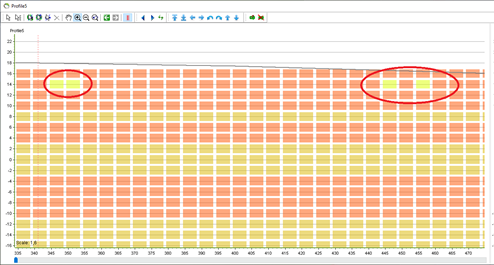
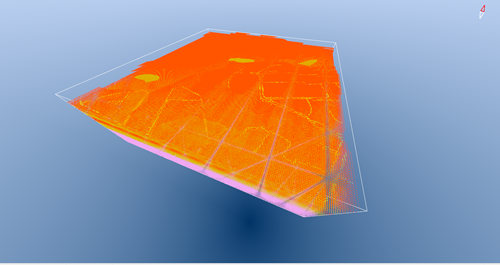
Vectors blending
In GeoScene3D you can now import vector themes, which can be modelled as 3D objects. You can use the vectors for a visual overview, or you can use the vectors to blend and/or change grid nodes in a geological voxel model. All vector themes need information regarding thickness, widths and depths – this can however also be added manual in GeoScene3D. The opportunities are to set a new value for specific grid nodes, add a specific value or blend/change the value of a specific grid node. If using the blend/change opportunity in the voxel grid the new grid value is calculated based on the percentage of overlap between the vector and the specific grid node. It is also possible to change/blend regarding to more than one vector theme. This is called multi blend. If the vector themes are date-tagged, this information can also be used to blend/change regarding the latest data.
As an example, this vector importer has been used in GeoScene3D for modeling near surface urban geological models, which need to be updated with buried pipelines (e.g. from sewage systems, district heating pipelines, gas pipelines and water pipelines), conduits and roads. The result of this editing of the voxel grid is a better and more detailed picture of the geology in the near surface layers, where the anthropogenic changes are great influencers.
Requirements
Data
The vector file should be a shape file with a database file included as well as a .prj, .qpj, and a .shx file.

Step 1. Adding the vector data
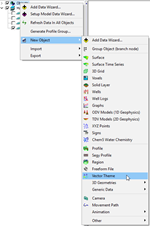
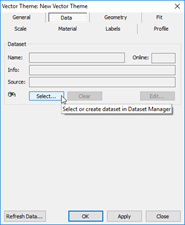
1. Right click the “Objects” node in GeoScene3D. Go to “New Object” → Vector Theme. When the new window opens press “Data” → “Select”.
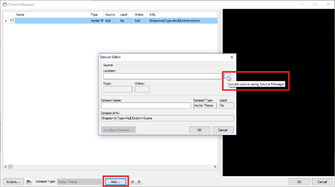
2. The “Dataset Manager” opens. Press “Add…” and when the “Dataset Editor” opens press “Locate source using Source Manager”.
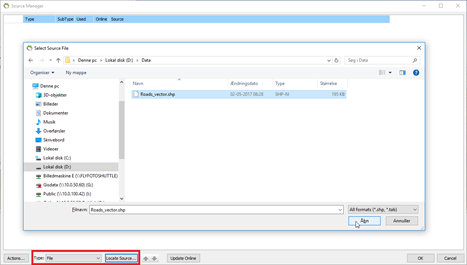
3. The “Source Manager” opens. Choose “File” in the Type drop down menu, and press “Locate Source”. Now you can select the vector shapefile. Press “Open”.
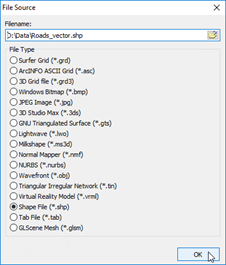
4. Select “Shape File” in the “File Source” and press “OK”. Press “OK” in the “Source Manager”.
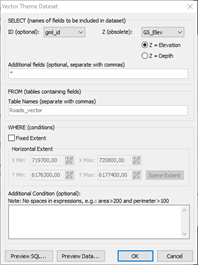
5. The “Vector Theme Dataset” opens automatically. Select the “ID” (optional) and the Z value. If you have other conditions, you can edit here. Press “OK”.
6. In the “Dataset Editor” you can change the “Dataset Name”, and you can see how many vectors are visualized in the current scene extent (“Dataset Info”). Press “OK”.
7. You are now at the “Dataset Manager” again. You can now see file details, and a preview of the data in your current scene extent. Press “OK”.
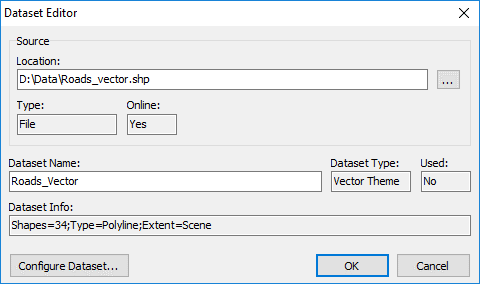
When finished adding the vector files, please remember to press “refresh” in the “Object manager”. Remember to press “refresh”, every time you change parameters affecting the visualization.
Step 2. Changing the visualization in GeoScene3D.
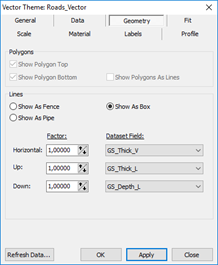
1. In the “object manager” → “Geometry” you can change the geometry. The lines can be shown as a fence, box or a pipe. You are able to pick out dataset fields, and/or you can can set a factor.
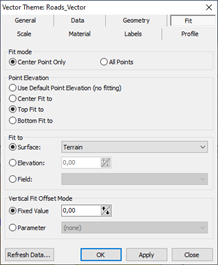
2. In the “Object Manager” → “Fit” you can change how and what the vectors should fit. If you choose the “Center Point Only” the vector will fit using the center point meaning if you have large/long vectors the end points could be affected negatively. This can be solved using the “All Point” fit, which uses all points during the vector.
The “Point Elevation” defines where on the vectors vertical extent, it is fitted. And the “Fit To” defines in which depth the vectors are placed. You can fit to a surface, a specific elevation or use an already defined depth from the vectors database. In addition you can choose a vertical fit offset, either a fixed value or a parameter from the vectors database.
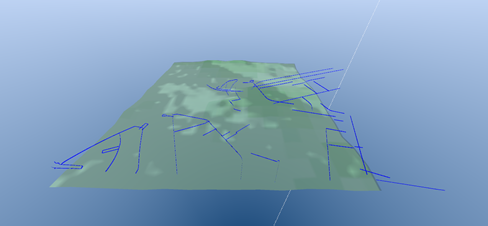
Vectors in the 3D space fitted with the bottom fit to the terrain surface: (this makes the vectors placed above the terrain).
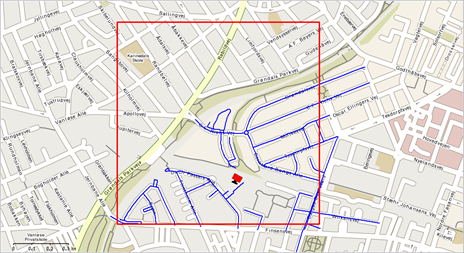
Vectors on the map:

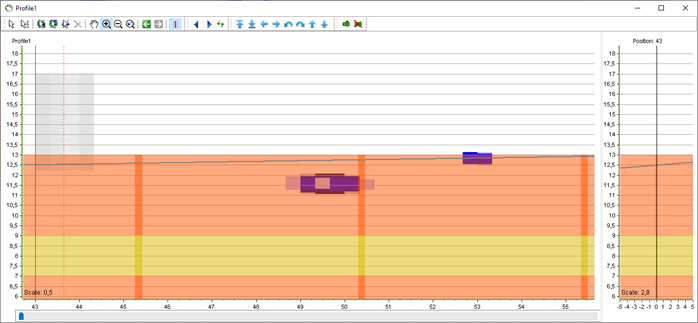
Vectors on the profiles: The gray solid box are a building fittet with the “bottom fit” to the terrain surface. The blue pipe is a water pipe given a 1 m radius and fittet with “center fit” to the terrain surface with an vertical offset of -1 m. The blue solid box is a section of a road with the geometry from the vector database and fitted with “top fit” to the terrain surface.
Step 3. Edit the 3D grid/voxel grid
1. Add a 3D grid /voxel grid.
2. Click the ”Start edit session”. The “Grid Editor” (and the “Linked Grids Editor”) will then appear.

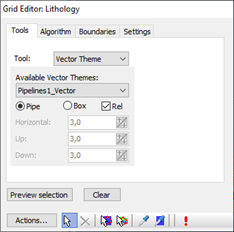
3. Under “Tools” pick “Vector Theme” in the drop down menu, and the concerned vector theme. If the vector theme is a pipe the calculation uses the settings from the “object properties”. If the vector theme is a box you can set the length of the horizontal, up and down lengths.

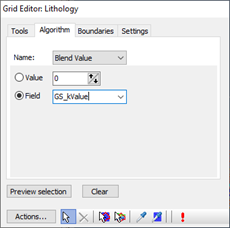
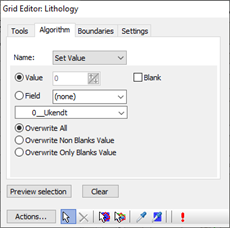
4. Under “Algorithm” you can choose the algorithm – bland, set, add, or multiply. You can choose a fixed value or a field from the vector database. If you choose the “Set value”, you have the opportunity to overwrite all, overwrite non blank values or overwrite only blank values.
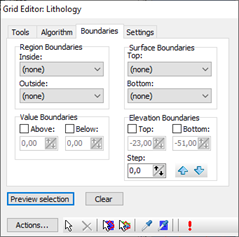
5. Under “Boundaries” you can set a region and/or surface and/or value and/or elevation boundaries for the changes of the voxel grid.
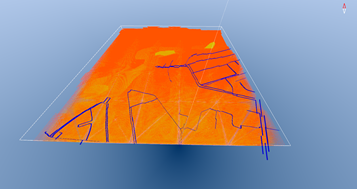
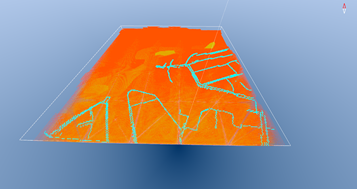
6. If you click the “Preview selection” (and the voxel grid is visual in the 3D space (or on profiles)), you can see the selected grid nodes before running the blending/changing.
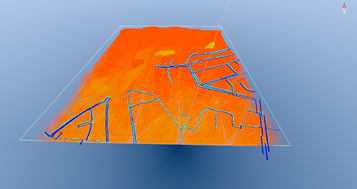
The vectors (blue) and the voxel grid:
The selected nodes (light blue) in the voxel grid:
Combination of the two above:
7. Press the  to run the calculation.
8. Check if the calculation produces the expected result and save the changes to the voxel grid. Click “Stop edit session”, and confirm to save the edits.

Step 4. The result
Step 5. Multiblend with respect for the newest data
1. Follow step 3.3.
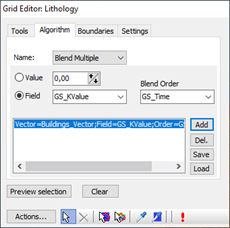
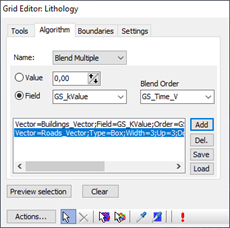
2. Under “Algorithm” you can choose the algorithm – bland, set, add, or multiply. If you choose the “Blend Multiple”, you can pick the field (a value from the vector database) and a blend order (in this case a time stamp from the vector database). Press “Add”.
3. Go back to the “Tools” page and pick another vector theme. Set the Field under the “Algorithm” page and press “Add”. You now have 2 vector themes selected. You can add as many vector themes as you like, and you can see the selected noted by pressing “Preview selected”. The “Boundaries” and “Settings” are the same as in step 13.
If you want to use the same settings again you can save the settings.
4. Press  , to run the calculation. Then see step 3.8.

