Table of Contents
Analyze Screens Theme
This will help you setting up a screen theme for your project.
Requirements
Data
This requires well data including screens and one or more layers from a layer model as either aquifer or non-aquifer layers.
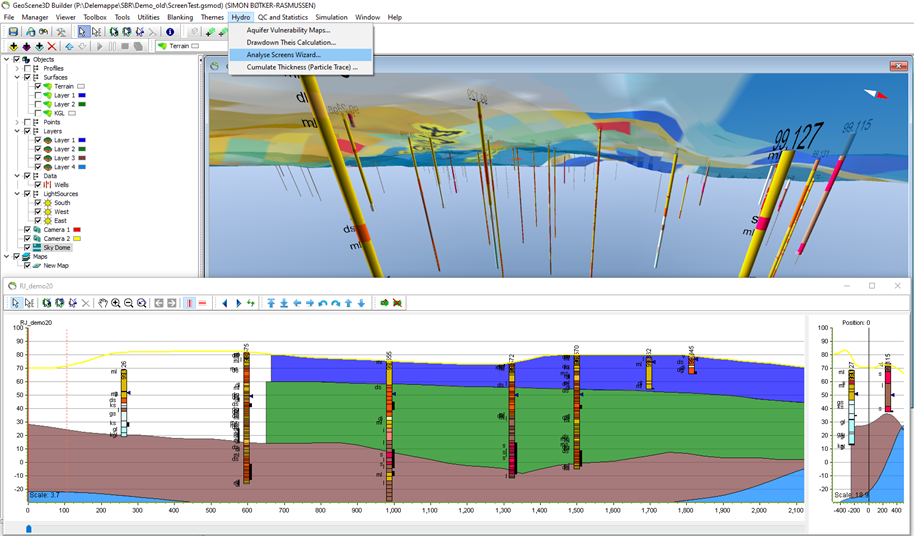
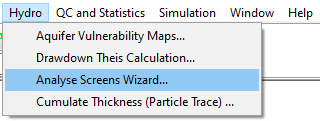
Step 1. Open Wizard
Step 2. Wizard pages
1.Select the wells with screens and etc. Constrain Calculation to Region:
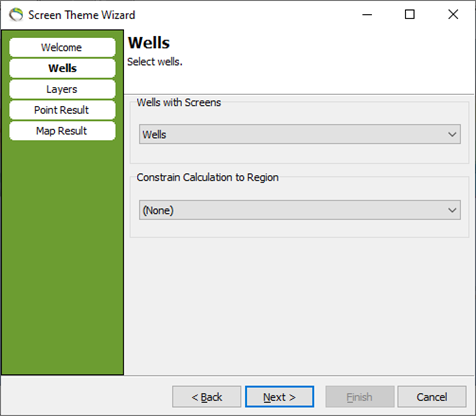
2.Select one or more layers from a layer model as either aquifer or non-aquifer layers.
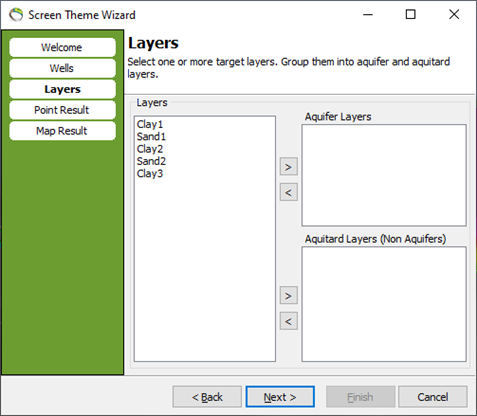
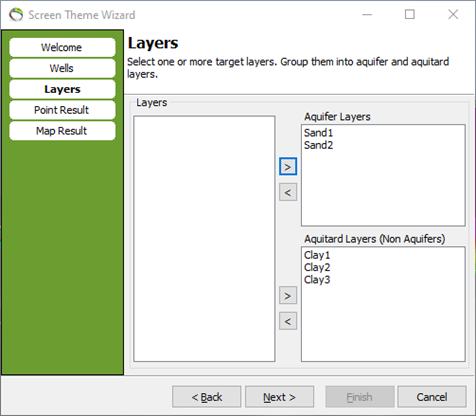
3.Select a group, a color scale and an offset for the resulting XYZ points. The position offset makes it possible to see several filters from a single well on the map next to each other (and not overlapping).
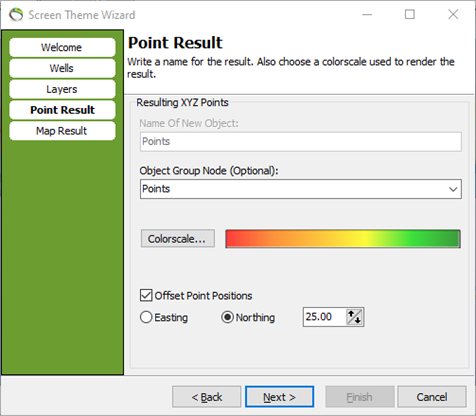
4.Add the result to a map
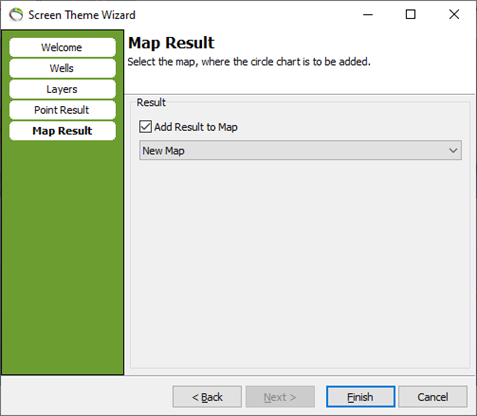
Step 3. Result
The result is points in 3D and circle charts on the map
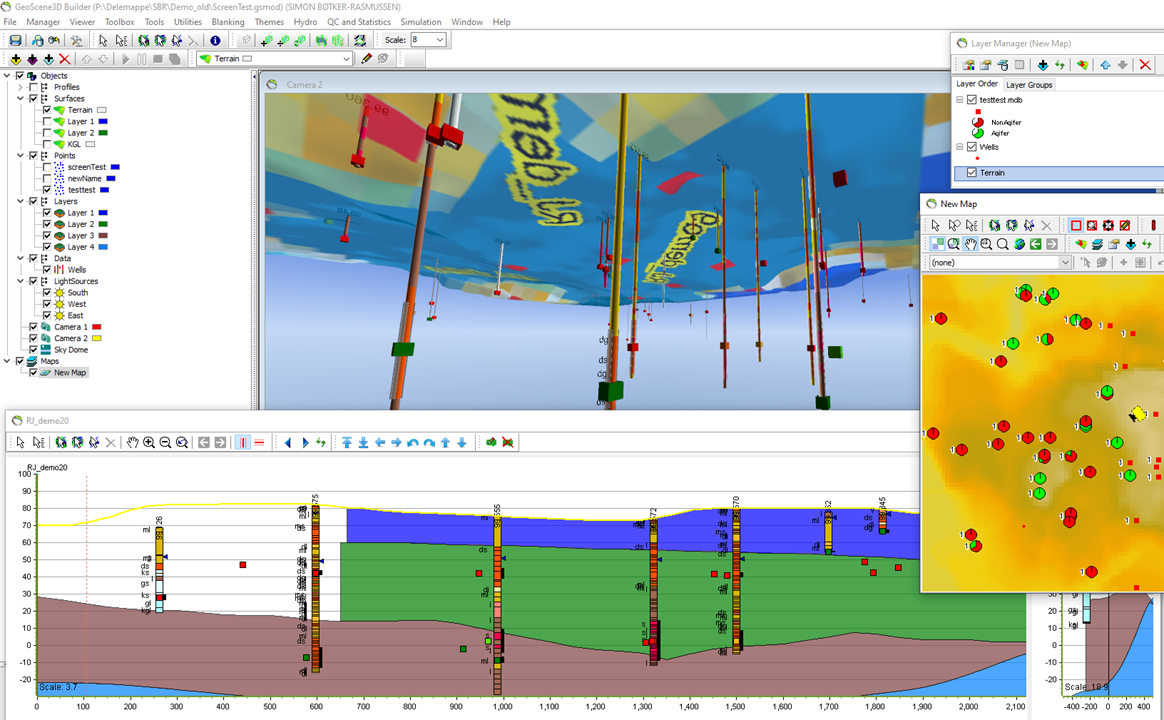
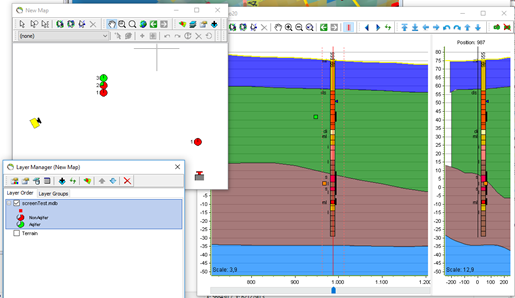
The resulting points is positioned at the filter midpoints (plus the offset). The circle charts show the percentage of the screen in aquifer as green and the percentage in non-aquifer as red. Below is a well with tree filters, one in aquifer, one in non-aquifer, and the middle one on both. The laves is the screen number.
For a filter in multiple layers, it is possible at the Map Window to label the percentage of the layers the filter is placed in.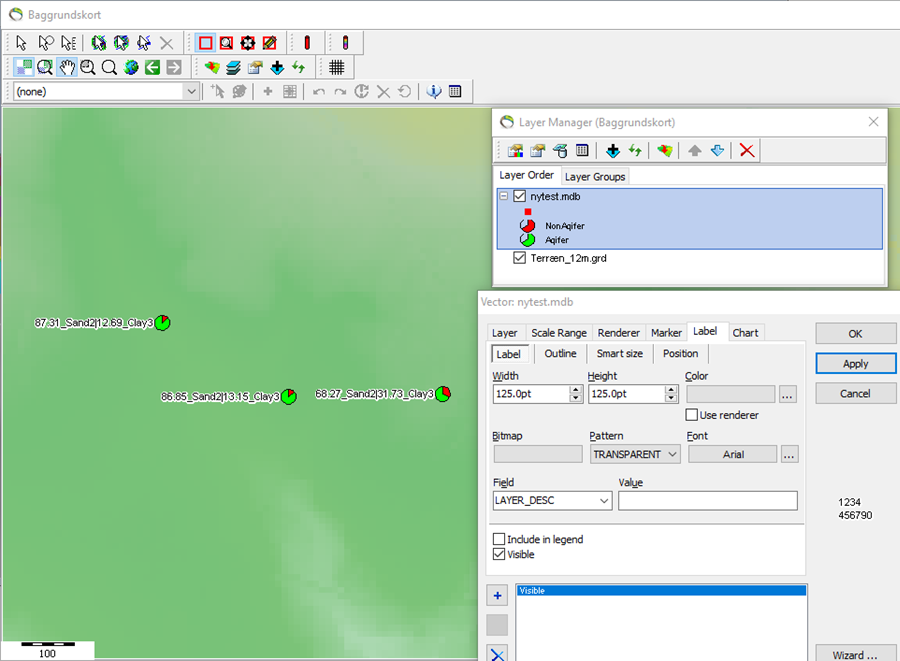
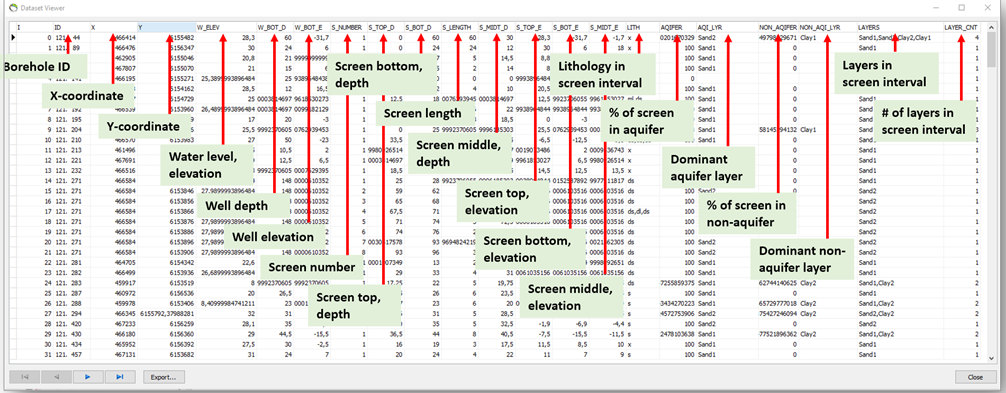
In the result database several other numbers and texts are added. These can be used for further visualization with colors or labels.
The database will look something like this:
